External Monitoring for Kubernetes: Why Internal Probes Are Not Enough
Every pod is passing its liveness probes and your cluster dashboard is green but a customer outside your network can't load the app at all. Learn why internal Kubernetes health checks aren't enough, and what external monitoring catches that they can't.
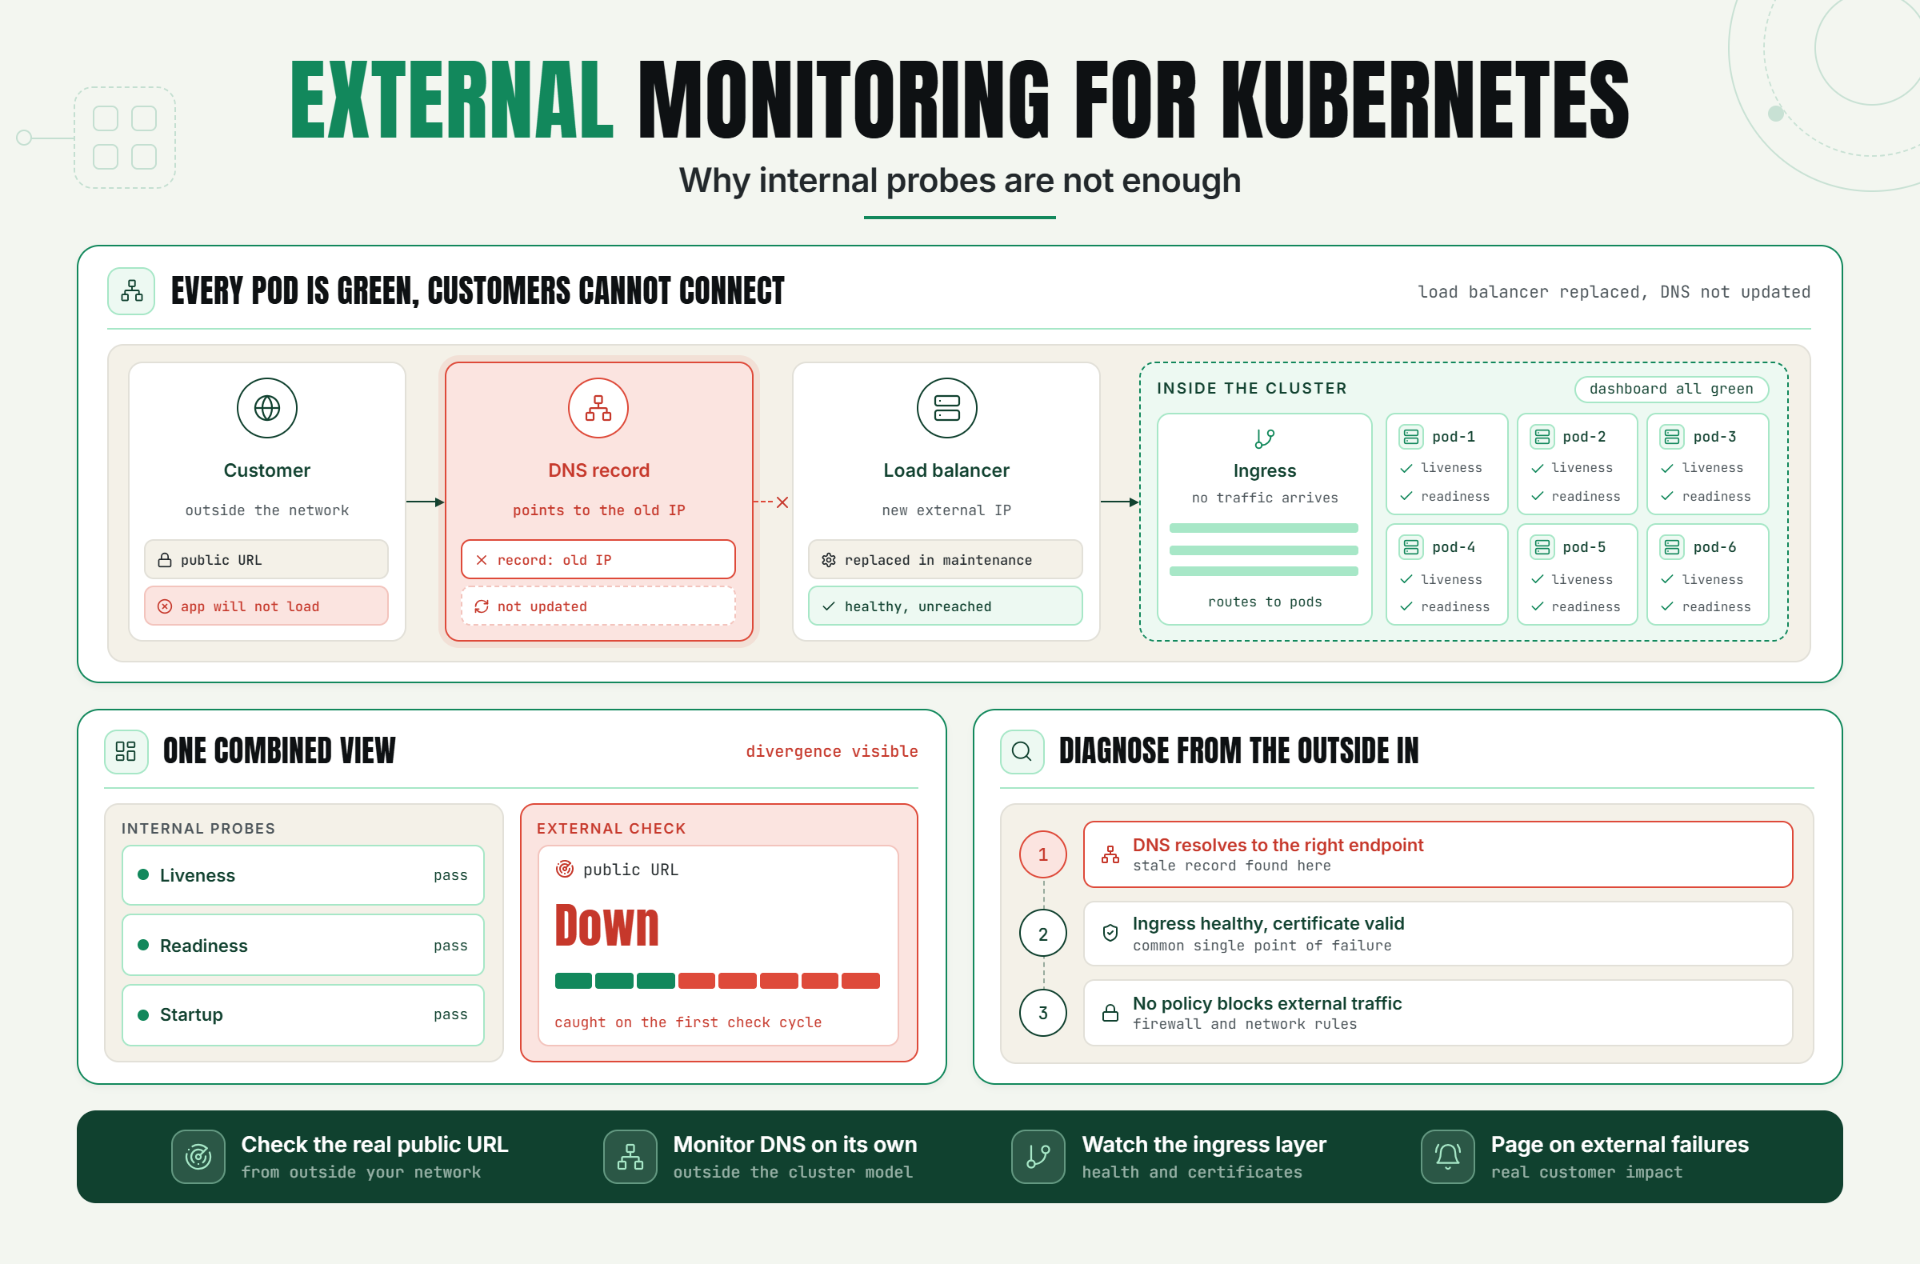
Every pod is passing its liveness and readiness probes. The cluster dashboard shows everything green. And a customer, sitting outside your network entirely, can't load your application at all, because the ingress controller lost its public IP an hour ago and nothing inside the cluster has any way of knowing.
Kubernetes external monitoring exists because internal health checks answer a fundamentally different question than the one your customers actually care about. Probes tell you whether your pods are healthy from the cluster's own point of view. They tell you nothing about whether a real request, arriving from outside your network the way an actual user's request does, can successfully reach your application at all.
Why Kubernetes External Monitoring Matters to Reliability and Customer Experience
Kubernetes health checks liveness probes, readiness probes, startup probes are genuinely valuable tools, and Kubernetes uses them correctly for what they're designed to do, deciding whether to restart a container, whether to route traffic to a pod, and whether a pod has finished starting up. All of this happens entirely within the cluster's own internal view of the world.
None of it verifies that a request from outside the cluster can actually complete the entire path a real user's request has to take: through DNS, through a load balancer or ingress, through network policies, and only then into the pod that a liveness probe has been dutifully confirming is healthy the entire time. Cluster availability from the inside and application availability from the outside are related, but they are not the same claim, and the gap between them is exactly where a real, customer facing outage can hide behind a fully green internal dashboard.
The Operational Risk of Relying on Internal Probes Alone
Kubernetes clusters introduce several layers between "the pod is healthy" and "a customer can use the application," and each layer is a place where internal probes have no visibility at all:
- Ingress and load balancer failures are invisible to pod level probes. A liveness probe only checks whether its own container is responding; it has no way of knowing whether the ingress controller routing external traffic to that pod is itself healthy, reachable, or correctly configured.
- DNS misconfigurations sit entirely outside the cluster's internal health model. If a domain's DNS record doesn't correctly point to your cluster's external endpoint, every pod inside can be perfectly healthy while zero real traffic ever arrives.
- Network policies and firewall rules can silently block legitimate external traffic. A security group or network policy change can prevent external requests from ever reaching the cluster, without triggering a single internal probe failure, since the pods themselves are never even queried.
- A liveness probe passing doesn't confirm the application is actually functioning correctly for a real request. A probe often checks a simple, lightweight endpoint specifically designed to be fast and reliable which can pass even while a more complex, realistic user request fails due to a downstream dependency issue the probe was never designed to detect.
Without a service endpoint check running from outside the cluster and outside your own network, teams frequently discover these failures only when a customer reports the application as unreachable, at which point the internal dashboards showing every pod healthy actively point troubleshooting attention in the wrong direction first.
How Kubernetes External Monitoring Works: Key Signals, Thresholds, and Diagnosis
Liveness Probe vs. Uptime Monitor: Two Different Jobs
The core distinction is worth stating plainly: a liveness probe vs uptime monitor comparison isn't really a competition between two similar tools they check fundamentally different things. A liveness probe asks, from inside the cluster, "should Kubernetes restart this specific container?" An external uptime monitor asks, from outside the cluster, "can a real request, following the exact path a customer's request would take, successfully reach and receive a correct response from the application?" Both answers matter. Neither substitutes for the other.
What External Monitoring Actually Checks
External Kubernetes monitoring sends requests to your application's public facing endpoint from outside your infrastructure entirely, verifying the complete path: DNS resolution, ingress routing, TLS/SSL handling, and the actual application response, exactly as a real customer's request would experience it.
Ingress Monitoring Specifically
Ingress monitoring deserves particular attention because the ingress controller is frequently the single point where external traffic transitions into the cluster. A misconfigured ingress rule, an expired certificate at the ingress layer, or an ingress controller that itself becomes unhealthy can each independently break external access while every pod behind it remains completely healthy and unaware anything is wrong.
Key Signals to Track
| Signal | What It Catches |
|---|---|
| External endpoint response (from outside the cluster) | Whether real, external traffic can actually reach the application |
| DNS resolution for the public facing domain | Whether DNS is correctly pointing to the cluster's external endpoint |
| Ingress controller health and certificate validity | Ingress layer failures invisible to pod level probes |
| Full request response cycle time (external) | End to end latency as experienced by a real user, not just internal pod response time |
| Comparison between internal probe status and external check status | Whether an external failure is occurring despite healthy internal probes |
Diagnosis: Internal Healthy, External Failing
When internal probes show a fully healthy cluster while an external check is failing, the investigation should move immediately outward, layer by layer: confirm DNS is resolving correctly to the expected external endpoint, confirm the ingress controller itself is healthy and correctly configured, and confirm no network policy or firewall rule is blocking legitimate external traffic. This diagnostic direction starting from the outside and working in is usually faster than starting from pod level logs that, in this specific failure pattern, are unlikely to show anything unusual at all.
A Practical Production Scenario
A platform team runs a cloud native SaaS application on Kubernetes, with comprehensive internal monitoring: liveness and readiness probes on every pod, cluster level dashboards, and alerting tied to pod restarts and resource utilization. Every internal signal has been reliably green for weeks.
During a routine cloud provider maintenance window, the load balancer associated with the cluster's ingress is replaced with a new one, and the DNS record pointing to it isn't updated to reflect the new external IP address. Every pod inside the cluster continues running normally, completely unaffected and unaware, while the actual public entry point to the application has silently changed out from under it.
Customer reports of the application being unreachable begin arriving within minutes, but the team's internal dashboards show no anomalies whatsoever no failed probes, no pod restarts, no resource alerts. It's only when someone thinks to check the application from outside the corporate network, hitting the same public URL a customer would use, that the DNS mismatch becomes obvious. An external monitor configured to check the same public endpoint would have caught this within the first check cycle after the DNS record went stale, rather than requiring a customer report to trigger the investigation.
Recommended Monitor Setup
- Configure external checks against your application's actual public facing endpoint, run from outside your own infrastructure and network entirely.
- Monitor DNS resolution for your public domain as its own explicit signal, separate from internal cluster health.
- Monitor ingress controller health and certificate validity specifically, since this layer is a common single point of external failure.
- Compare internal probe status against external check status as a combined view, so a divergence between the two is immediately visible rather than requiring manual cross-referencing.
- Alert on external check failures with high priority, since a failure here directly represents real, current customer impact.
Best Practices for Kubernetes External Monitoring
Treat Internal Probes and External Checks as Complementary, Not Redundant
Kubernetes health checks answer questions about container and pod health from inside the cluster. External monitoring answers a different, equally necessary question about whether a real customer request can actually succeed. Both belong in a complete monitoring strategy.
Check the Exact Public Endpoint Your Customers Use
An external check against anything other than your actual production public URL doesn't validate the real path a customer's request takes, including DNS, ingress, and TLS termination exactly as they experience it.
Give Ingress Its Own Dedicated Monitoring Attention
Because the ingress layer is frequently the single external entry point into the cluster, its health, configuration, and certificate validity deserve monitoring as explicit, first class signals, not an assumed byproduct of pod level health.
Monitor DNS as a Distinct Layer From Cluster Health
DNS misconfigurations sit entirely outside Kubernetes' own health model, and a domain incorrectly pointing to a stale or incorrect endpoint won't trigger any internal cluster alert on its own.
Build a Combined View of Internal and External Health
Displaying internal probe status and external check status together makes a divergence between the two immediately visible, which is often the clearest, fastest signal of exactly this type of external-only failure.
Prioritize External Check Failures Appropriately
An external check failure represents real, current customer facing impact by definition, since it's measuring the same path a real customer's request takes, and should generally be treated with high urgency.
Common Mistakes in Kubernetes External Monitoring
Mistake 1: Assuming Healthy Internal Probes Mean the Application Is Reachable
Why it happens: a fully green internal dashboard feels like sufficient confirmation of overall health.
What to do instead: run external checks against the actual public endpoint, since internal probes have no visibility into DNS, ingress, or network layer issues outside the cluster.
Mistake 2: Not Monitoring DNS as a Separate, Explicit Signal
Why it happens: DNS is often assumed to be a "set it and forget it" configuration that doesn't need ongoing attention.
What to do instead: monitor DNS resolution for your public facing domain independently, since a stale or incorrect record can break access without triggering any cluster level alert.
Mistake 3: Treating the Ingress Layer as an Afterthought
Why it happens: attention tends to concentrate on pod and container level health, since that's where Kubernetes' own tooling is most visible.
What to do instead: give ingress controller health, configuration, and certificate validity dedicated monitoring, since this layer is a common single point of external failure.
Mistake 4: Checking a Test Endpoint Instead of the Real Public URL
Why it happens: a simpler or internal-only endpoint can seem like an easier target to monitor.
What to do instead: monitor the exact public endpoint customers actually use, so the check reflects the real path, including DNS and ingress, that a genuine request takes.
Mistake 5: Not Comparing Internal and External Health Side by Side
Why it happens: internal and external monitoring are often built and viewed as separate, disconnected systems.
What to do instead: build a combined view so a divergence between healthy internal probes and a failing external check is immediately obvious, rather than requiring manual investigation to notice.
Mistake 6: Under Prioritizing External Check Failures
Why it happens: without internal signals also showing a problem, an external failure alone can be mistakenly treated as less urgent or possibly a false positive.
What to do instead: treat external check failures as high priority by default, since they directly represent the exact experience real customers are having right now.
Start Monitoring What Your Customers Actually Experience
A fully healthy internal dashboard says nothing about whether a real customer, outside your network, can actually reach your application right now. Those are two different claims, and the gap between them is exactly where DNS, ingress, and network layer failures hide.
Start a 30 day Statixoup beta and configure external monitoring against your Kubernetes hosted application's real public endpoint. The next ingress or DNS failure won't get to hide behind a cluster of perfectly healthy pods.