API Error Rate Monitoring: When 4xx and 5xx Spikes Need Different Alerts
Learn how API error rate monitoring helps teams detect reliability issues before they become outages. Understand the difference between 4xx and 5xx errors, how to create meaningful alert thresholds, and how to use error-rate monitoring to protect API performance and customer experience.
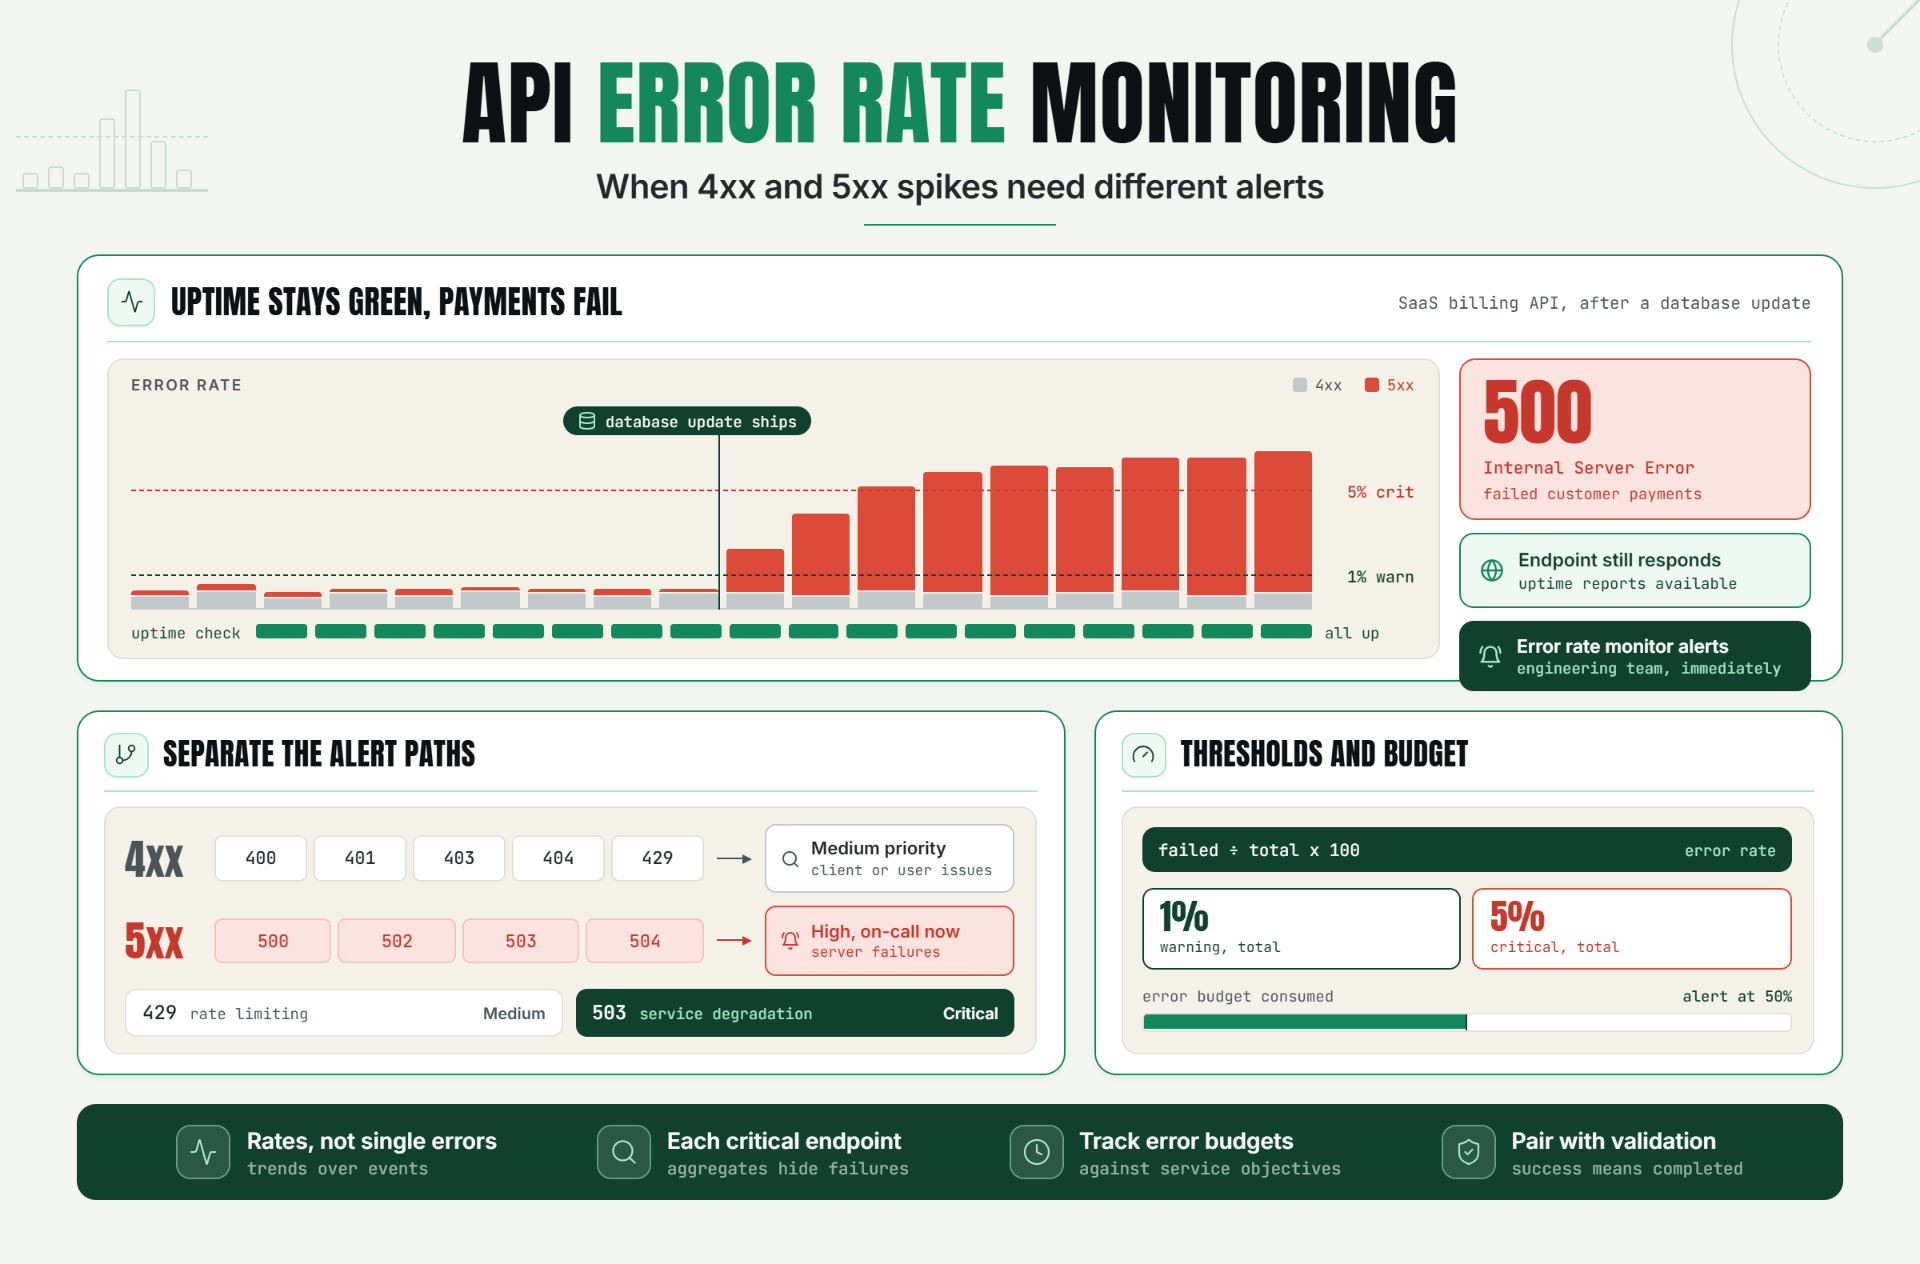
Most API monitoring systems focus on uptime and response times. While those metrics are important, they don't always reveal whether users are successfully completing requests.
An API can remain online while returning large numbers of errors. Customers experience failures, integrations break, and support tickets increase-even though uptime dashboards appear healthy.
API error rate monitoring helps teams measure reliability by tracking how often requests fail and identifying trends before they become major incidents.
Not all errors are equal. A spike in 4xx responses often indicates client-side issues, while increasing 5xx responses usually signal server-side problems that require immediate investigation.
The Operational Risks Teams Face Without Effective API Error Rate Monitoring
Monitoring only uptime creates blind spots. APIs can continue responding while large percentages of requests fail.
Without effective API error rate monitoring, organizations risk:
- Undetected API failures.
- Customer-facing outages.
- Slow incident detection.
- Missed SLA violations.
- Higher support volumes.
- Integration failures.
- Reduced customer trust.
Error rates provide a more accurate picture of service reliability than isolated status checks.
Teams that monitor error rates can identify degradation early and respond before customers are significantly affected.
How API Error Rate Monitoring Works, Key Signals, Thresholds, and Diagnosis
What Is API Error Rate Monitoring?
API error rate monitoring measures the percentage of requests that fail over a given period.
Basic formula:Error Rate = Failed Requests ÷ Total Requests x 100Instead of analyzing individual failures, teams track trends and percentages across all API traffic.
Understanding 4xx Errors
HTTP 4xx responses typically indicate client-side issues.
Common examples include:
- 400 Bad Request
- 401 Unauthorized
- 403 Forbidden
- 404 Not Found
- 429 Too Many Requests
Not every 4xx response indicates a platform outage. However, sudden spikes may signal authentication issues, broken clients, deployment mistakes, or documentation problems.
Understanding 5xx Errors
HTTP 5xx responses generally indicate server-side failures.
Common examples include:
- 500 Internal Server Error
- 502 Bad Gateway
- 503 Service Unavailable
- 504 Gateway Timeout
Unlike many 4xx errors, 5xx spikes usually require immediate operational attention because they indicate platform instability.
Why Separate 4xx and 5xx Alerts?
| Error Type | Typical Cause | Alert Priority |
|---|---|---|
| 4xx Errors | Client or user issues | Medium |
| 5xx Errors | Server failures | High |
| 429 Errors | Rate limiting | Medium |
| 503 Errors | Service degradation | Critical |
Different error categories require different operational responses and escalation paths.
Key Signals to Monitor
| Signal | Purpose |
|---|---|
| Total Error Rate | Measure reliability |
| 4xx Error Rate | Detect client issues |
| 5xx Error Rate | Detect platform failures |
| Endpoint Error Rate | Identify affected services |
| Error Budget Consumption | Track SLA performance |
Recommended Thresholds
- Warning: 1% total error rate
- Critical: 5% total error rate
- Immediate investigation: Any sustained 5xx spike
- Error budget alert: 50% budget consumed
A Realistic Production Scenario and Recommended Monitor Setup
Scenario: SaaS Billing API Incident
A SaaS company deploys a database update affecting its billing service.
Within minutes, API requests begin returning:
Error response: 500 Internal Server ErrorTraditional uptime checks continue reporting successful availability because the API endpoint still responds.
Error-rate monitoring detects a sudden increase in failed requests and immediately alerts the engineering team.
The Business Impact
- Failed customer payments.
- Revenue disruption.
- Customer frustration.
- Increased support requests.
Recommended Monitor Setup
| Monitor Type | Purpose |
|---|---|
| Availability Monitor | Verify uptime |
| Error Rate Monitor | Track failures |
| Endpoint Validation Monitor | Verify functionality |
| Latency Monitor | Measure performance |
This layered approach provides better visibility than uptime monitoring alone.
Best Practices: Coverage, Check Frequency, Validation, Ownership, and Escalation
1. Separate 4xx and 5xx Alerts
Different error categories require different operational responses.
2. Monitor Error Rates, Not Individual Errors
Trends provide more actionable insights than isolated events.
3. Track Error Budgets
Align monitoring with reliability objectives and SLAs.
4. Monitor Critical Endpoints Individually
Aggregate metrics can hide localized failures.
5. Combine Error Monitoring with Response Validation
Availability alone does not guarantee successful transactions.
6. Define Ownership
Assign clear responsibility for incident response.
7. Create Escalation Policies
Critical 5xx spikes should immediately reach on-call teams.
Common Mistakes: Weak Checks, Noisy Alerts, Missing Dependencies, and Poor Routing
Mistake 1: Treating All Errors Equally
Better approach: Create separate rules for 4xx and 5xx categories.
Mistake 2: Monitoring Status Codes Only
Better approach: Measure overall error percentages.
Mistake 3: Ignoring Error Budgets
Better approach: Track reliability against service objectives.
Mistake 4: Alerting on Every Failure
Better approach: Use thresholds and trend-based alerts.
Mistake 5: Poor Escalation Routing
Better approach: Send critical alerts directly to responsible teams.
Reliable APIs Require Error Rate Visibility
Uptime monitoring alone cannot measure API reliability. Teams must understand how frequently requests fail and whether customers can successfully complete transactions.
By monitoring total error rates, separating 4xx and 5xx alerts, and tracking error budgets, organizations can detect issues faster and reduce the impact of production incidents.
The first step is implementing dedicated error-rate monitoring for your most critical APIs and defining thresholds that align with business expectations.
Start Monitoring API Error Rates Today
Ready to detect API reliability issues before customers notice them?
Start your 30-day Statixoup beta and configure API error rate monitoring for your critical services.
Track 4xx and 5xx trends, monitor error budgets, and receive actionable alerts before minor failures become major outages.