API Latency Monitoring: Set Thresholds Before Slow Responses Become Outages
Learn how API latency monitoring helps detect performance issues before they become outages. Discover how to set latency thresholds, track p95 response times, and identify slow API behavior before customers are affected.
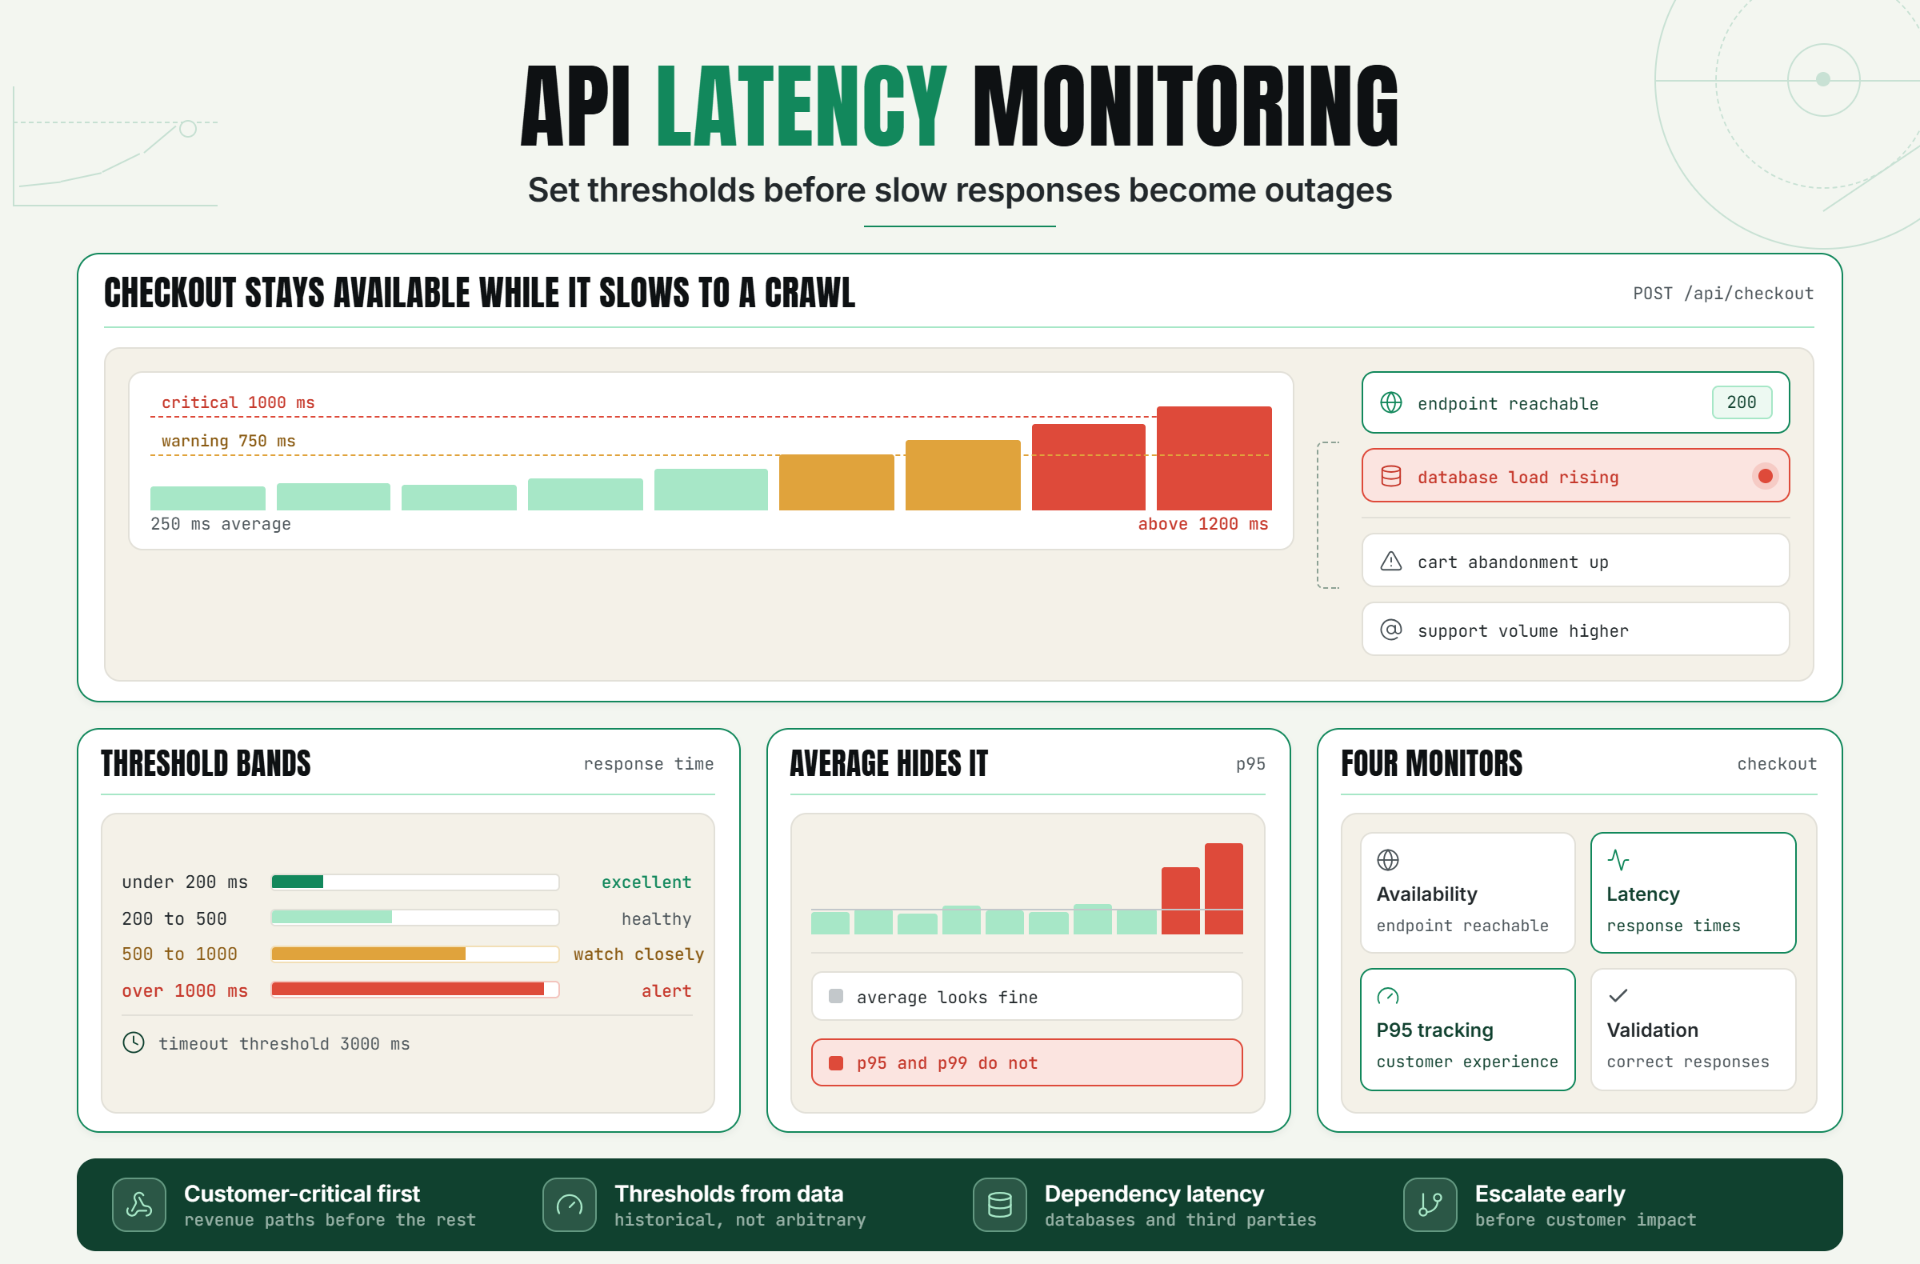
API availability is only part of the reliability equation. An API can remain online while becoming increasingly slow, causing degraded user experiences, failed transactions, and frustrated customers.
For engineering teams, latency issues are often early warning signs of larger problems. Database bottlenecks, overloaded infrastructure, dependency failures, and inefficient queries frequently appear as performance degradation before they cause complete outages.
API latency monitoring helps teams detect these issues early by measuring response times, tracking performance trends, and triggering alerts when thresholds are exceeded.
The Operational Risks Teams Face Without Effective API Latency Monitoring
Many monitoring strategies focus exclusively on uptime and availability. While detecting outages is important, slow APIs can cause significant customer impact long before a service becomes unavailable.
Without API latency monitoring, organizations risk:
- Undetected performance degradation.
- Poor customer experience.
- Increased abandonment rates.
- Failed transactions and workflows.
- Missed SLA targets.
- Delayed incident response.
- Unexpected outages caused by unresolved performance issues.
By the time customers report slowness, performance problems may already be affecting critical business operations.
How API Latency Monitoring Works, Key Signals, Thresholds, and Diagnosis
What Is API Latency Monitoring?
API latency monitoring measures how long an API takes to process and return responses.
The goal is to identify performance degradation before users experience noticeable slowdowns or service interruptions.
What Is API Response Time?
Response time measures the total duration between sending a request and receiving a response.
Example response time: 250msResponse time includes application processing, database queries, network latency, and dependency interactions.
Understanding p95 Latency
Average response times can hide performance issues.
Many engineering teams use percentile measurements instead.
Example: p95 latencyP95 latency represents the response time experienced by 95% of requests.
This provides a more realistic view of customer experience than simple averages.
Common API Latency Thresholds
| Response Time | Status |
|---|---|
| Less than 200 ms | Excellent |
| 200 - 500 ms | Healthy |
| 500 - 1000 ms | Monitor closely |
| More than 1000 ms | Alert threshold |
Key Signals to Monitor
- Average response time.
- P95 latency.
- P99 latency.
- Timeout frequency.
- Error rates.
- Dependency latency.
- Regional performance differences.
Diagnosing Latency Problems
Performance degradation often originates from:
- Database bottlenecks.
- Third-party API delays.
- Network congestion.
- Infrastructure resource exhaustion.
- Application code inefficiencies.
Latency monitoring helps identify trends before they escalate into outages.
A Realistic Production Scenario and Recommended Monitor Setup
Scenario: Ecommerce Checkout API
An ecommerce platform exposes a checkout endpoint used by customers during purchases.
Endpoint:POST /api/checkoutInitially, response times average 250 ms.
Over several hours, database load increases and response times rise above 1200 ms.
The API remains available, but customers begin experiencing checkout delays.
The Impact
- Increased cart abandonment.
- Customer frustration.
- Revenue loss.
- Higher support volume.
Recommended Monitor Setup
| Monitor Type | Purpose |
|---|---|
| Availability Monitor | Verify endpoint accessibility |
| Latency Monitor | Track response times |
| P95 Tracking | Measure customer experience |
| Response Validation | Verify correct responses |
Example Threshold Configuration
- Warning threshold: 750ms
- Critical threshold: 1000ms
- Timeout threshold: 3000ms
Best Practices: Coverage, Check Frequency, Validation, Ownership, and Escalation
1. Monitor Customer-Critical Endpoints
Prioritize APIs that directly impact user experience and revenue.
2. Use Percentile-Based Metrics
Track p95 and p99 latency instead of relying only on averages.
3. Define Meaningful Thresholds
Set warning and critical thresholds based on historical performance.
4. Combine Latency and Availability Monitoring
Fast outage detection and performance visibility should work together.
5. Monitor Dependencies
Track latency from databases, third-party APIs, and external services.
6. Use Frequent Monitoring Intervals
Critical APIs should typically be monitored every 30 - 60 seconds.
7. Define Escalation Procedures
Ensure alerts reach the correct teams before customer impact increases.
Common Mistakes: Weak Checks, Noisy Alerts, Missing Dependencies, and Poor Routing
Mistake 1: Monitoring Only Availability
Better approach: Monitor response times alongside uptime.
Mistake 2: Using Average Response Time Only
Better approach: Track p95 and p99 latency.
Mistake 3: Setting Arbitrary Thresholds
Better approach: Base thresholds on real performance data.
Mistake 4: Ignoring Dependency Latency
Better approach: Monitor databases and external services.
Mistake 5: Alerting Too Late
Better approach: Trigger alerts before latency becomes customer-visible.
Performance Issues Become Reliability Issues
API latency monitoring helps teams identify performance degradation before customers experience significant disruptions.
By tracking response times, monitoring p95 latency, and setting proactive thresholds, organizations can reduce downtime, improve user experience, and respond faster to incidents.
The first step is identifying critical APIs and defining meaningful latency thresholds that reflect real customer expectations.
Start Monitoring API Latency Today
Ready to detect slow responses before they become outages?
Start your 30-day Statixoup trial and configure your first API latency monitor.
Track response times, monitor latency thresholds, and receive alerts before performance issues impact customers.