Database Health Endpoint Monitoring: Detect Connection Pool and Query Failures
Your server is up, your load balancer is green and every request is failing because the connection pool exhausted itself twenty minutes ago. Learn how database health monitoring catches connection pool and query failures that infrastructure checks can't see.
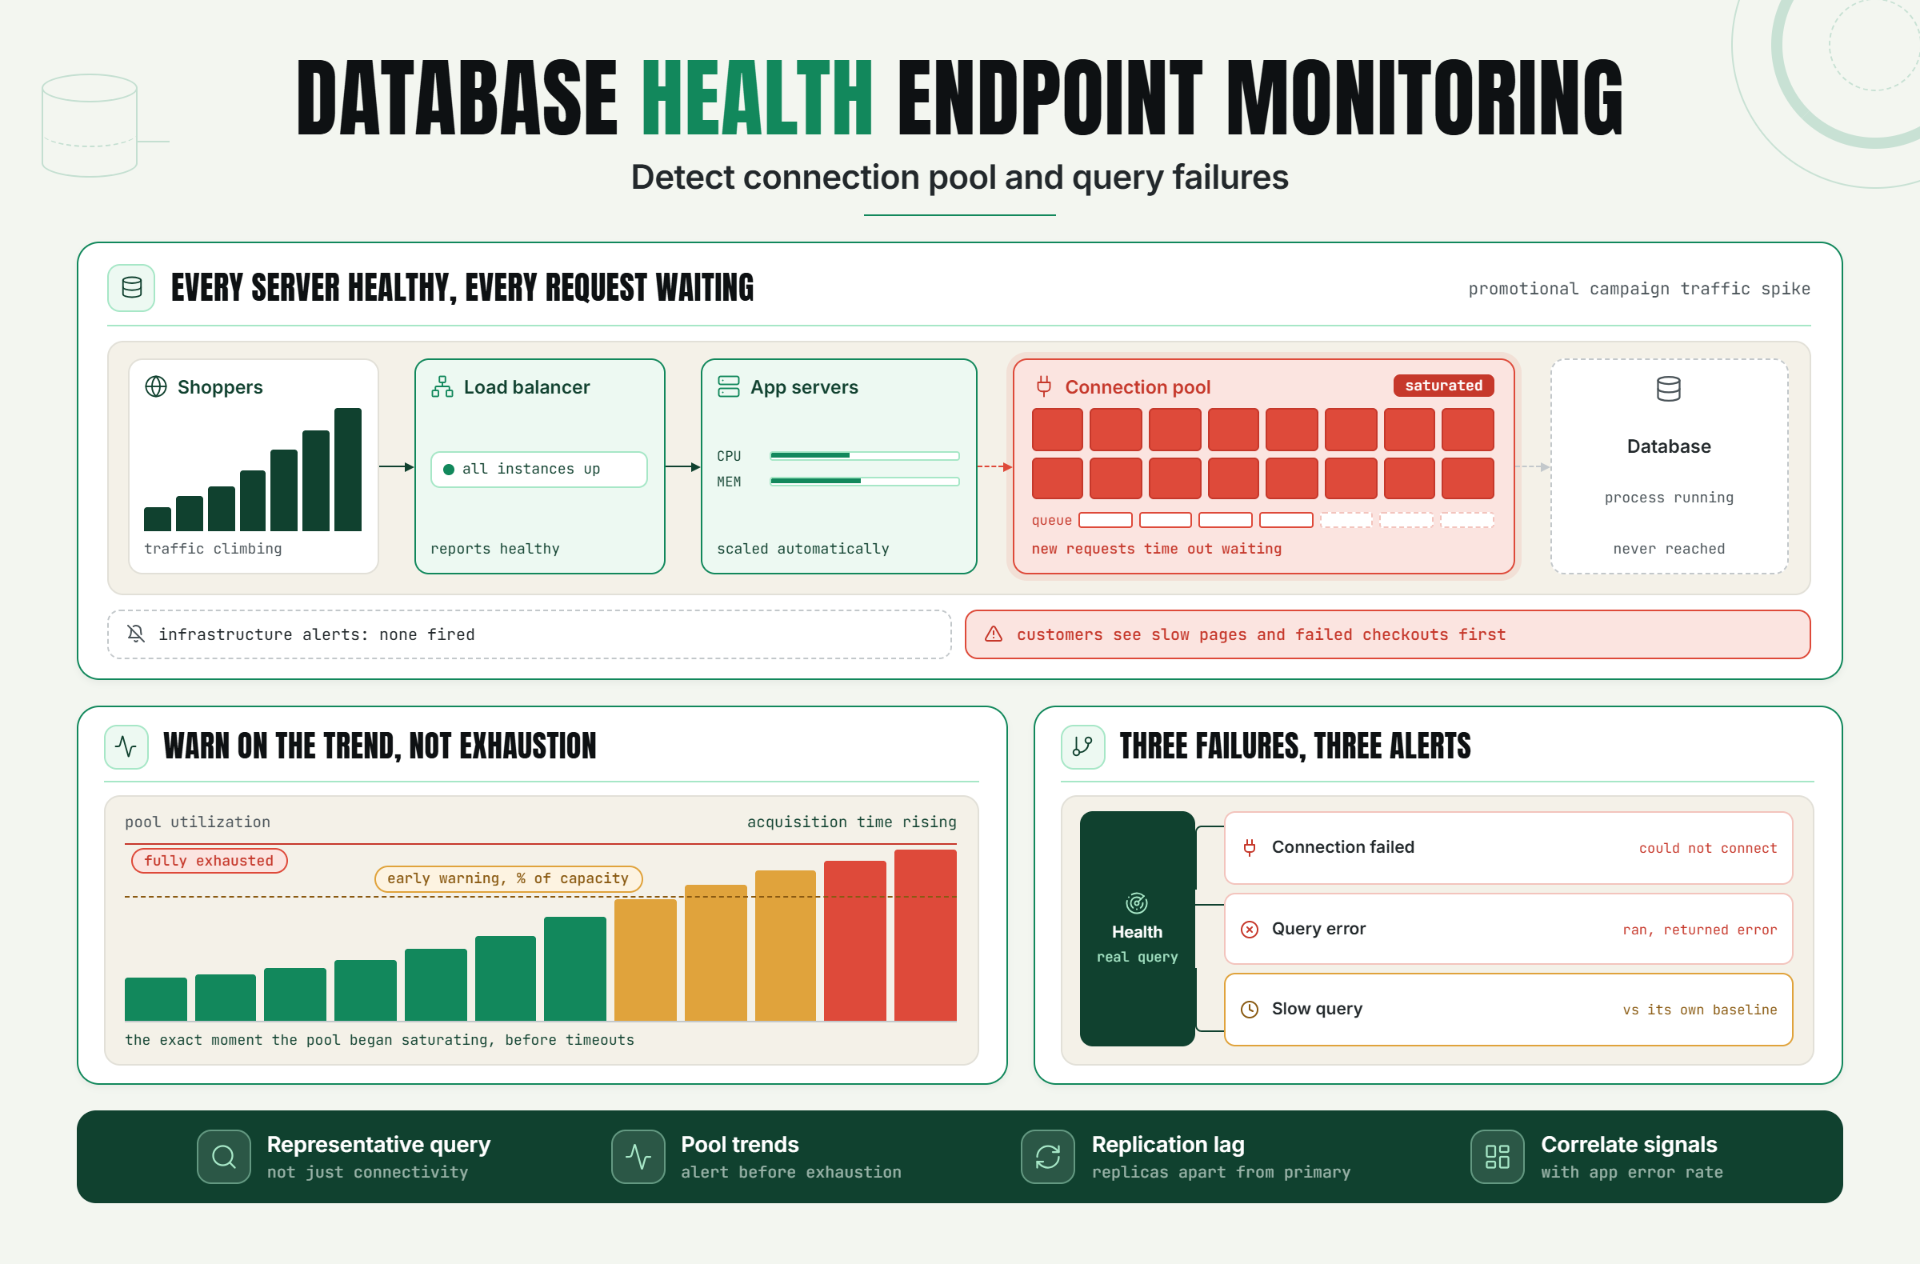
The application server is up. The load balancer reports healthy. And every single request is failing, because the connection pool exhausted itself twenty minutes ago and every new request is timing out waiting for a database connection that will never become available. None of your infrastructure level monitoring has any way of seeing this, because from the outside, the server is running exactly as expected.
Database health monitoring exists to close this specific, common gap. A database can be the actual point of failure behind an outage while every surface level check server uptime, process status, load balancer health continues to report everything as fine, because none of those checks were ever designed to look at the one dependency actually causing the problem.
Why Database Health Monitoring Matters to Reliability and Customer Experience
Nearly every meaningful action a user takes on a typical application eventually touches a database: logging in, loading a dashboard, submitting a form, completing a purchase. When the database layer degrades, even while the server hosting the application remains technically online, the practical effect for a real user is identical to a full outage nothing works, regardless of how healthy the surrounding infrastructure appears.
Database availability, in the way that actually matters to customers, isn't just about whether the database process is running. It's about whether the application can successfully establish a connection, execute a query, and receive a correct result, within an acceptable amount of time, under real production conditions. Any one of those steps can fail independently, and a database that's technically running but effectively unusable produces exactly the same broken experience as one that's fully down.
The Operational Risk of Not Monitoring Database Health Directly
Teams that rely solely on infrastructure level monitoring, without an explicit database health check, tend to miss a specific category of failure that sits invisibly between "server is up" and "application works correctly":
- Connection pool exhaustion looks nothing like a server failure. When an application's connection pool runs out of available connections, often due to slow queries holding connections longer than expected, or a spike in concurrent requests, new requests simply queue or fail waiting for a connection, while the server itself, the database itself, and every basic health check continue reporting normally.
- Slow queries degrade the experience long before they cause an outright failure. A query that used to run in milliseconds and now takes several seconds doesn't trigger a typical uptime alert, but it directly and measurably degrades every user facing action that depends on it.
- A database can accept connections while failing to execute queries correctly. Basic connectivity checks that only confirm a connection can be established don't verify that an actual query, representative of real application behavior, executes successfully and returns the expected result.
- Replication lag and read replica issues are invisible to a primary only health check. An application reading from a lagging or unhealthy replica can serve stale or inconsistent data while the primary database, and any monitoring pointed only at it, shows nothing wrong.
Without a dedicated database endpoint check verifying actual query execution and connection health, teams typically discover these issues the way they discover most application layer failures: through a spike in customer reported errors or slow page loads, well after the underlying database degradation began, and often after considerable time spent incorrectly investigating the application server or network layer first.
How Database Health Monitoring Works: Key Signals, Thresholds, and Diagnosis
What a Database Health Endpoint Actually Checks
A well designed database health check goes beyond simply confirming the database process is running. It typically executes a lightweight but representative query something that exercises the actual connection pool and query execution path the application relies on and verifies both that the query completes successfully and that it completes within an acceptable time window.
Connection Pool Monitoring
Connection pool monitoring tracks how many connections are currently in use versus available, how long requests are waiting to acquire a connection, and how often connection acquisition times out entirely. A connection pool trending toward exhaustion is often visible well before it actually runs out, provided something is watching the trend rather than only alerting once the pool is already fully saturated.
Query Failure Alerts
A query failure alert should distinguish between different categories of failure: a connection that couldn't be established at all, a query that executed but returned an error, and a query that executed successfully but took longer than an acceptable threshold. Each of these points toward a different underlying cause and benefits from being surfaced separately rather than collapsed into one generic "database issue" alert.
Application Dependency Health in Context
Database health is one part of a broader picture of application dependency health, and it's most useful when correlated with other application level metrics. A spike in application error rates that coincides precisely with a spike in query failures or connection timeouts is a much clearer diagnostic signal than either metric reviewed in isolation.
Key Signals to Track
| Signal | What It Catches |
|---|---|
| Connection acquisition time and timeout rate | Connection pool exhaustion or saturation trending toward failure |
| Query execution time for representative queries | Slow queries degrading user experience before an outright failure |
| Query success vs. failure rate | Queries executing but returning errors, distinct from connectivity issues |
| Replication lag (if using read replicas) | Stale or inconsistent data being served from a lagging replica |
| Correlation between database signals and application error rate | Confirming a database-layer cause behind broader application symptoms |
Setting Thresholds
Query execution time thresholds are most useful when set relative to each specific query's own normal baseline rather than a single number applied universally, since different queries have very different acceptable performance characteristics depending on their complexity and the data they touch. Connection pool thresholds are often more effective as an early trend warning alerting when utilization crosses a meaningful percentage of total pool capacity rather than waiting until the pool is completely exhausted to raise any signal at all.
Diagnosis: Isolating a Database Layer Failure
When application level symptoms appear slow responses, elevated error rates the fastest way to confirm or rule out the database as the cause is checking whether connection acquisition time, query execution time, or query failure rate show a corresponding, correlated change during the same window. A clear correlation strongly suggests the database layer; the absence of one points the investigation elsewhere.
A Practical Production Scenario
An ecommerce platform experiences a sudden traffic increase during a promotional campaign. The application servers scale automatically and show healthy CPU and memory utilization throughout the event. The load balancer reports every server instance as healthy.
Behind the scenes, the database's connection pool, sized for typical traffic levels, becomes saturated as request volume climbs. New requests begin queuing to acquire a connection, and a growing share eventually time out entirely rather than ever reaching the database.
From the application server and load balancer's perspective, nothing looks unusual, since the servers themselves are handling requests normally, simply waiting on a resource that isn't available.
Customer facing symptoms slow page loads, failed checkout attempts begin appearing before any infrastructure level alert fires, since infrastructure monitoring was never watching connection pool health specifically.
Once a dedicated database health check correlating connection acquisition time with the traffic spike is added, the team can see the exact moment the pool began saturating, well before it became a full connection timeout crisis, and adjusts pool sizing accordingly for the remainder of the campaign.
Recommended Monitor Setup
- Configure a database health endpoint that executes a representative query and checks both success and execution time, not just basic connectivity.
- Monitor connection pool utilization and acquisition time as an early warning signal, alerting well before the pool is fully exhausted.
- Track query failure rate and query execution time as separate, distinct signals, rather than one combined database health status.
- If using read replicas, monitor replication lag explicitly, since a healthy primary database doesn't guarantee healthy replica reads.
- Correlate database signals with broader application error rate and response time, to confirm or rule out the database as the cause of a wider symptom.
Best Practices for Database Health Monitoring
Check Actual Query Execution, Not Just Connectivity
A connection succeeding doesn't confirm the database can actually execute the queries your application depends on. A representative health check query, exercising the real path your application uses, provides a more accurate signal.
Monitor Connection Pool Trends, Not Just Exhaustion
Watching connection pool utilization as a trending metric, rather than only alerting once it's fully exhausted, provides meaningful early warning before requests actually start failing.
Separate Different Types of Query Failures
A failed connection, a query error, and a slow but successful query each point toward different causes, and benefit from distinct alerts rather than being grouped into one generic database status.
Monitor Replication Lag If You Use Read Replicas
A primary database showing perfect health says nothing about whether your read replicas are current, and stale replica reads can produce subtly incorrect application behavior that's easy to miss without explicit monitoring.
Set Query Thresholds Relative to Each Query's Own Baseline
Different queries have inherently different normal performance characteristics, making a query's own historical baseline a more useful comparison point than one universal threshold applied across all queries.
Correlate Database Signals With Application Level Symptoms
Reviewing database health alongside application error rate and response time makes it much faster to confirm whether a broader symptom traces back to the database layer specifically.
Common Mistakes in Database Health Monitoring
Mistake 1: Only Checking Basic Database Connectivity
Why it happens: confirming a connection can be established feels like sufficient validation on its own.
What to do instead: execute a representative query as part of the health check, since successful connectivity doesn't guarantee successful query execution.
Mistake 2: Waiting Until the Connection Pool Is Fully Exhausted to Alert
Why it happens: a binary "pool exhausted or not" check is simpler to configure than a trending threshold.
What to do instead: monitor connection pool utilization as a trend, alerting at a meaningful percentage of capacity well before full exhaustion actually occurs.
Mistake 3: Grouping All Query Failures Into One Generic Alert
Why it happens: it's simpler to have a single "database error" alert than to distinguish between failure types.
What to do instead: separate connection failures, query errors, and slow queries into distinct signals, since each points toward a different underlying cause.
Mistake 4: Not Monitoring Read Replicas Separately From the Primary
Why it happens: attention often concentrates on the primary database, since that's typically where writes and critical operations occur.
What to do instead: monitor replication lag and read replica health explicitly, since a healthy primary doesn't guarantee current or healthy replica reads.
Mistake 5: Using a Single Universal Threshold for All Query Performance
Why it happens: a single shared threshold is simpler to configure than per-query baselines.
What to do instead: set thresholds relative to each specific query's own normal performance, since acceptable execution time varies significantly by query complexity.
Mistake 6: Not Correlating Database Signals With Application Level Metrics
Why it happens: database and application monitoring are often built and viewed as separate, disconnected systems.
What to do instead: review database health signals alongside application error rate and response time, making it faster to confirm or rule out the database as the source of a broader symptom.
Start Monitoring the Dependency Behind Most of Your Outages
A healthy server and a healthy load balancer say nothing about whether the database behind them can actually serve a request. That gap is exactly where connection pool exhaustion and query failures hide until customers are already affected.
Start a 30 day Statixoup beta and configure database health monitoring that checks real query execution and connection pool trends, not just basic connectivity. The next database layer failure won't get to hide behind a healthy looking server.