Deployment Monitoring Checklist: What to Watch Before and After Every Release
Your CI/CD pipeline shows green and everyone moves on but a successful deploy and a safe deploy are two different claims. Learn what to watch before and after every release to catch regressions before customers do.
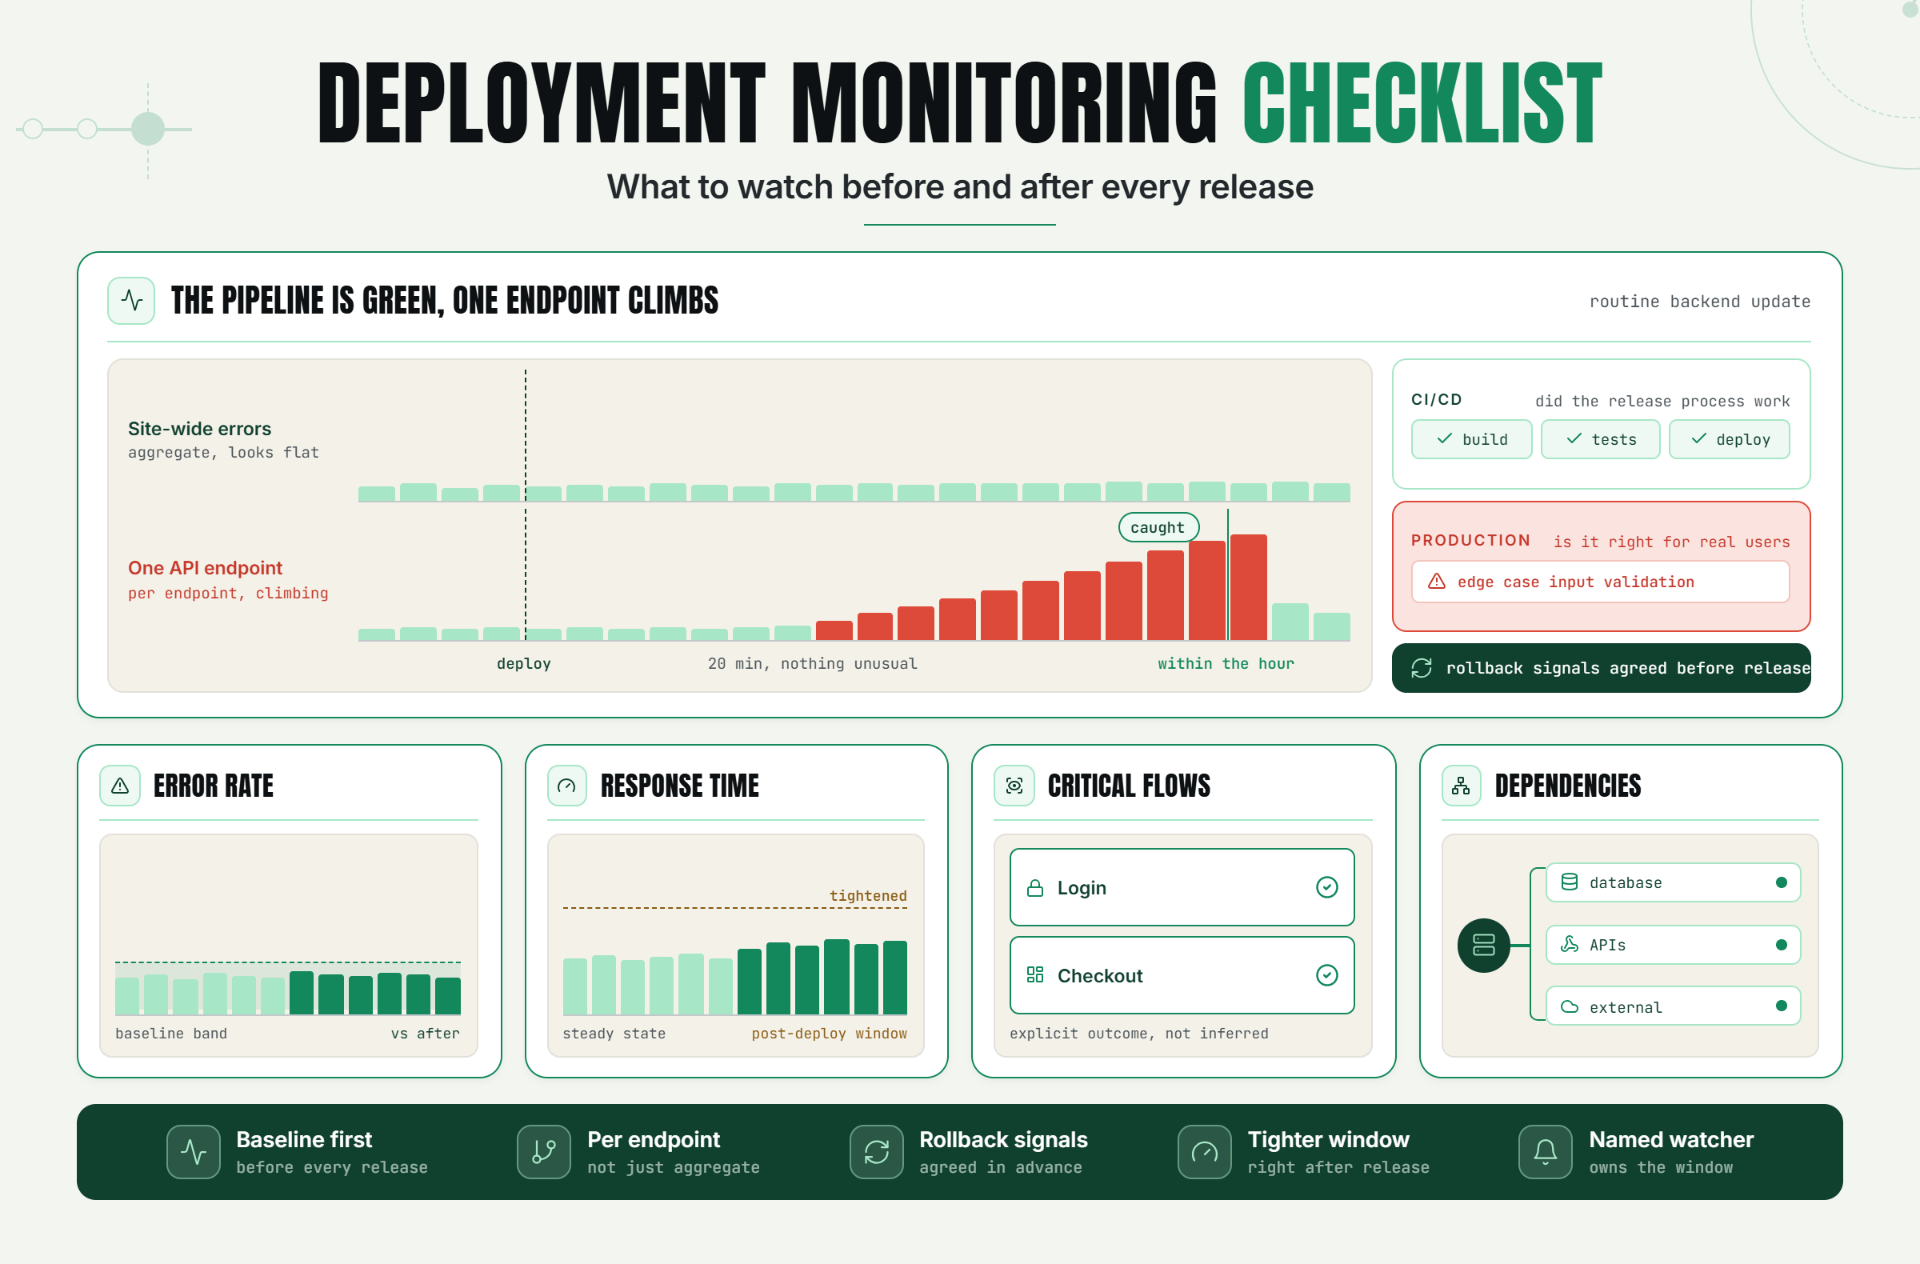
A deploy finishes. The CI/CD pipeline shows green. Everyone moves on to the next task. Forty minutes later, error rates start climbing on a code path nobody thought to check, and the first sign anyone gets is a customer complaint, not a monitor.
A deployment monitoring checklist exists because a successful build and a successful release are two different claims. CI/CD tools are very good at confirming code compiled, tests passed, and the deployment process itself completed without error. None of that confirms the application is actually behaving correctly in production, under real traffic, with real data.
Why a Deployment Monitoring Checklist Matters to Reliability and Customer Experience
Most teams have gotten reasonably good at catching problems before a deploy happens automated tests, staging environments, code review. Far fewer teams have an equally rigorous process for what happens in the minutes and hours immediately after a deploy goes live, which is exactly when a real production issue is most likely to surface.
Release monitoring matters because production is the one environment that can never be fully replicated beforehand. Real traffic patterns, real data shapes, and real third party dependencies all behave differently than any staging environment can simulate. A deploy that passed every pre release check can still introduce a regression that only shows up under actual production conditions, and the gap between "the deploy succeeded" and "the deploy is actually fine" is exactly where a deployment monitoring checklist earns its value.
The Operational Risk of Treating "Deployed" as "Done"
Without a deliberate post deployment monitoring process, teams tend to fall into a few predictable and costly patterns:
- The pipeline's success signal gets treated as the only signal that matters. A green CI/CD status confirms the deployment mechanism worked, not that the deployed code is behaving correctly for real users.
- Attention drops off exactly when risk is highest. The period immediately following a release is statistically the most likely time for a new issue to surface, yet it's often the moment teams are least actively watching, having just moved on to the next task.
- Regressions in low traffic or edge case code paths go unnoticed for longer. A bug affecting a less frequently used feature can take hours or days to accumulate enough impact to be obviously visible, by which point far more users have been affected than if it had been caught early.
- Rollback decisions get made too late, or without clear criteria. Without predefined rollback signals agreed on in advance, teams often wait too long to decide a rollback is necessary, debating whether an issue is "bad enough" while it continues to affect users.
The core risk is straightforward: the earlier a deployment issue is caught, the smaller its blast radius and the easier the fix. Every additional minute of delayed detection expands both the number of affected users and the complexity of understanding what actually went wrong.
How Deployment Monitoring Works: Key Signals, Thresholds, and Diagnosis
Pre Deployment Signals to Confirm
Before a release goes out, a few checks establish the baseline you'll be comparing against afterward: current error rate, current response time, and current traffic patterns on the affected systems. Without this baseline, it's much harder to tell whether a metric change after deployment is meaningfully different from normal, or just ordinary variation.
Post Deployment Signals to Watch Closely
Post deployment checks should focus on a small set of high signal metrics, watched closely for a defined window immediately after release:
- Error rate — any meaningful increase compared to the pre-deployment baseline is one of the clearest and fastest signals something is wrong.
- Response time — a new deploy that introduces a performance regression often shows up here before it shows up as an outright error.
- Success rate on critical transactions — login, checkout, or whatever core flow matters most to your business, verified as an explicit outcome, not just inferred from general uptime.
- Dependency health — confirming that any external services, databases, or APIs the new code relies on are responding as expected under real traffic.
CI/CD Monitoring Versus Production Monitoring
CI/CD monitoring build status, test pass/fail, deployment success answers whether the release process itself worked correctly. Production monitoring after the fact answers a completely different question: is the software actually behaving correctly for real users, right now. Both matter, but conflating them is a common source of false confidence, since a smoothly executed deployment says nothing about the correctness of what was actually deployed.
Setting Thresholds for Deployment Monitoring
Thresholds during a post deployment monitoring window are often tighter than your steady state alerting, intentionally. A small error rate increase that wouldn't normally warrant urgent attention deserves closer scrutiny in the minutes following a release, since it's far more likely to be connected to the deploy itself than to be unrelated background noise.
Diagnosis: Confirming Whether an Issue Is Deployment Related
The fastest diagnostic question after a release is simple: did this metric change coincide with the deployment timestamp, or was it already trending this way beforehand? A clear correlation with the release time is strong evidence of a deployment related regression. A metric that was already drifting before the deploy points to a separate, likely unrelated cause.
A Practical Production Scenario
A team ships a routine backend update that includes a minor change to how a specific API endpoint handles an edge case in its input validation. All automated tests pass, staging looks fine, and the deploy completes without any errors reported by the pipeline.
For the first twenty minutes, nothing unusual appears in overall error rates, since the affected input pattern is relatively uncommon. As traffic accumulates through the following hour, error rates on that specific endpoint begin climbing steadily, though the increase is small enough relative to total traffic that it doesn't immediately stand out in an aggregate, site wide error rate metric.
Because the team maintains a post deployment monitoring window that checks error rates broken down by individual endpoint, not just as one combined average, the anomaly on this specific endpoint is caught within the first hour, well before it accumulates into a large scale, obviously visible problem. The fix is straightforward once identified but finding it quickly depended entirely on monitoring granular enough to catch a localized regression that a single aggregate metric would have diluted into invisibility.
Recommended Monitor Setup
- Establish a clear pre deployment baseline for error rate, response time, and critical transaction success rate before every release.
- Monitor at a granular level per endpoint, per service rather than relying solely on aggregate, site wide metrics that can dilute a localized regression.
- Define specific rollback signals in advance, agreed upon before the release, rather than deciding in the moment under pressure.
- Maintain a tightened alerting window for a defined period immediately following each deployment.
- Explicitly separate CI/CD success signals from production behavior monitoring, treating them as two distinct questions.
Best Practices for Deployment Monitoring
Define Rollback Signals Before You Deploy, Not During an Incident
Agreeing in advance on specific, measurable conditions that would trigger a rollback removes ambiguity and delay exactly when a fast decision matters most.
Monitor at a Granular Level, Not Just in Aggregate
A regression affecting a specific endpoint, region, or user segment can be invisible in a combined, site wide metric while still causing real, accumulating harm to a subset of users.
Tighten Alerting Temporarily After Each Release
A post deployment window with more sensitive thresholds catches emerging issues faster, since a small deviation is more likely to be deployment related during this period than at other times.
Validate Critical Transactions Explicitly, Not Just General Uptime
Confirm that core user journeys login, checkout, whatever matters most to your business are actually completing successfully after a release, rather than inferring correctness from the absence of an outright outage.
Separate CI/CD Success From Production Validation
A green pipeline confirms the deployment mechanism worked. It says nothing about whether the deployed code is behaving correctly under real production conditions, and treating the two as equivalent creates false confidence.
Assign Clear Ownership for the Post-Deployment Window
Decide in advance who is actively watching metrics immediately following a release, rather than assuming monitoring will simply catch and route any issue automatically.
Common Mistakes in Deployment Monitoring
Mistake 1: Treating a Green CI/CD Pipeline as Confirmation the Release Is Safe
Why it happens: a successful pipeline run feels like a natural stopping point.
What to do instead: treat pipeline success and production validation as two separate, sequential steps, with the second beginning only after the first completes.
Mistake 2: Only Watching Aggregate, Site Wide Metrics
Why it happens: a single combined dashboard is simpler to monitor than metrics broken down by endpoint or segment.
What to do instead: monitor at a more granular level for at least the post deployment window, since aggregate metrics can dilute a real, localized regression.
Mistake 3: Deciding Rollback Criteria in the Moment
Why it happens: it's easy to assume a rollback decision will be obvious when the time comes.
What to do instead: define specific rollback signals in advance, before the release, so a real incident doesn't turn into a debate about whether the problem is "bad enough."
Mistake 4: Using the Same Alert Thresholds Immediately After a Release as During Steady State
Why it happens: it's simpler to leave alerting configuration unchanged rather than adjusting it around each release.
What to do instead: temporarily tighten thresholds for a defined post deployment window, since a small deviation during this period is more likely to be deployment related.
Mistake 5: Not Validating Critical Transactions Explicitly
Why it happens: general uptime and error rate metrics feel like sufficient coverage on their own.
What to do instead: explicitly confirm that core business critical flows are completing successfully after a release, rather than inferring correctness from broader metrics alone.
Mistake 6: Letting Post Deployment Attention Drop Off Immediately
Why it happens: once a deploy completes without errors, it's natural to move on to the next task.
What to do instead: assign clear ownership for actively watching metrics during a defined window immediately following each release, rather than assuming issues will surface and route themselves.
Start Watching What Actually Matters After Every Release
A successful deployment and a safe deployment are two different claims, and the gap between them is exactly where production issues hide until a customer finds them first.
Start a 30 day Statixoup beta and configure monitoring that validates your critical transactions, error rates, and dependencies immediately before and after every release. The next regression won't get an hour's head start before someone notices.