GraphQL API Monitoring: Queries, Assertions, Errors, and Performance
Learn how GraphQL API monitoring helps detect query failures, schema issues, response errors, and performance bottlenecks before they affect users. Discover best practices for monitoring GraphQL endpoints, validating responses, and maintaining API reliability.
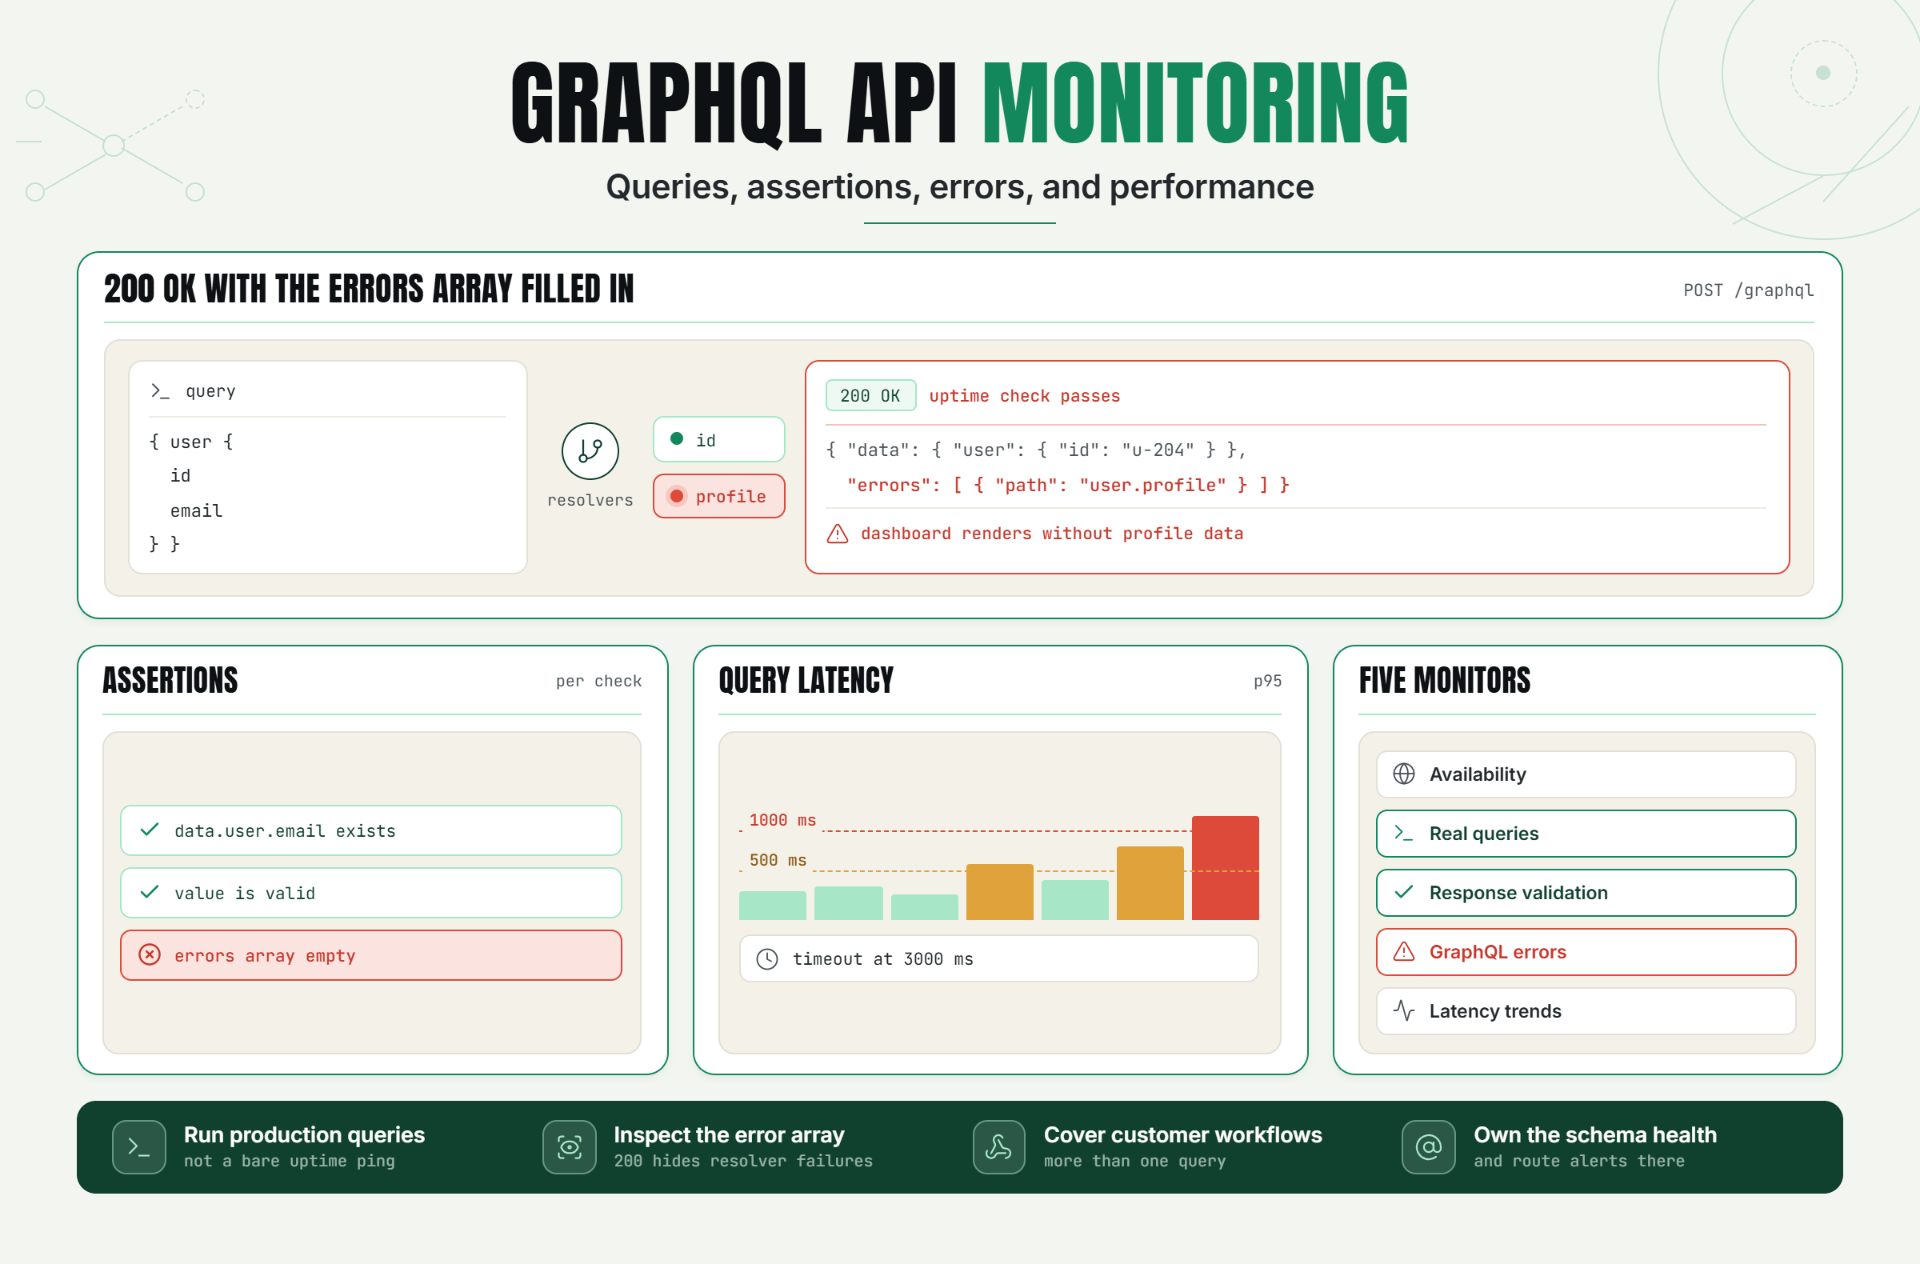
GraphQL has become a popular API architecture for modern applications because it allows clients to request exactly the data they need. While this flexibility improves developer productivity and application performance, it also introduces unique monitoring challenges.
Unlike traditional REST APIs, GraphQL endpoints typically operate through a single endpoint that serves many different queries and mutations. This means a simple uptime check may not be enough to verify that GraphQL services are functioning correctly.
GraphQL API monitoring helps teams validate query execution, detect schema issues, identify response errors, monitor latency, and ensure customers receive the expected data.
The Operational Risks Teams Face Without Effective GraphQL API Monitoring
Many teams assume that monitoring GraphQL availability is sufficient because the endpoint continues responding successfully.
However, GraphQL introduces unique failure scenarios that traditional API monitoring may miss.
Without GraphQL API monitoring, organizations risk:
- Undetected query failures.
- Schema-breaking changes.
- Partial response errors.
- Slow query performance.
- Resolver failures.
- Customer-facing data issues.
- Delayed incident detection.
A GraphQL endpoint may return successful HTTP responses while still delivering incomplete or incorrect application data.
How GraphQL API Monitoring Works, Key Signals, Thresholds, and Diagnosis
What Is GraphQL API Monitoring?
GraphQL API monitoring continuously validates the availability, functionality, performance, and correctness of GraphQL queries and mutations in production environments.
The objective is to detect issues that affect users before they become major incidents.
GraphQL Uptime Monitoring
The first layer of monitoring verifies that GraphQL endpoints remain reachable.
Example endpoint:POST /graphqlAvailability checks detect outages and connectivity issues but do not verify application functionality.
GraphQL Query Validation
Monitoring should execute real GraphQL queries and verify successful execution.
Example query:{ user { id email } }This ensures resolvers, schema definitions, and backend services operate correctly.
Response Validation
Successful HTTP responses do not guarantee successful GraphQL execution.
GraphQL often returns:200 OKEven when query execution contains errors.
Example error response:"errors":[]Monitoring should verify expected response fields and values.
Example assertion: data.user.emailExists and contains a valid value.
GraphQL Error Monitoring
GraphQL responses may contain execution errors while still returning valid HTTP status codes.
Monitoring should detect:
- Resolver failures.
- Authorization errors.
- Schema validation errors.
- Dependency failures.
- Query execution exceptions.
Performance Monitoring
Complex GraphQL queries can generate significant backend load.
Performance monitoring should track:
- Response times.
- P95 latency.
- P99 latency.
- Query execution duration.
- Error rates.
- Timeout frequency.
Key Monitoring Signals
| Signal | Purpose |
|---|---|
| Availability | Detect outages |
| Query Execution | Validate functionality |
| Response Assertions | Verify returned data |
| GraphQL Errors | Detect execution failures |
| Latency | Track performance |
| Timeouts | Identify degradation |
A Realistic Production Scenario and Recommended Monitor Setup
Scenario: SaaS Dashboard Using GraphQL
A SaaS platform relies on GraphQL to power its customer dashboard.
Endpoint:POST /graphqlA database issue causes user profile resolvers to fail intermittently.
The GraphQL endpoint continues responding successfully, but customer profile data becomes unavailable.
The Problem
HTTP response:200 OKYet GraphQL responses contain execution errors.
Traditional uptime monitoring may miss the incident entirely.
Recommended Monitor Setup
| Monitor Type | Purpose |
|---|---|
| Availability Monitor | Verify endpoint accessibility |
| Query Monitor | Execute production queries |
| Response Validation | Verify returned data |
| Error Monitoring | Detect GraphQL execution failures |
| Latency Monitoring | Track performance trends |
Example Alert Thresholds
- Warning latency: 500ms
- Critical latency: 1000ms
- Timeout threshold: 3000ms
Best Practices: Coverage, Check Frequency, Validation, Ownership, and Escalation
1. Monitor Real Queries
Use production-representative queries instead of simple availability checks.
2. Validate Response Content
Verify expected fields and values are returned.
3. Check for GraphQL Errors
Inspect error arrays and execution failures.
4. Monitor Performance Metrics
Track latency, execution times, and timeout rates.
5. Cover Critical Business Workflows
Monitor queries that directly affect customers.
6. Define Ownership
Assign responsibility for GraphQL schema health and monitoring.
7. Establish Escalation Procedures
Ensure alerts reach the appropriate engineering teams quickly.
Common Mistakes: Weak Checks, Noisy Alerts, Missing Dependencies, and Poor Routing
Mistake 1: Monitoring Only Endpoint Availability
Better approach: Execute real GraphQL queries.
Mistake 2: Ignoring GraphQL Errors
Better approach: Validate the error response structure.
Mistake 3: Not Verifying Returned Data
Better approach: Add response assertions.
Mistake 4: Overlooking Performance
Better approach: Monitor latency and query execution times.
Mistake 5: Monitoring Too Few Queries
Better approach: Cover critical customer workflows.
Effective GraphQL Monitoring Requires More Than Uptime Checks
GraphQL API monitoring provides visibility into query execution, response correctness, performance, and error conditions that traditional uptime monitoring may miss.
By validating real queries, checking response assertions, monitoring GraphQL errors, and tracking latency, teams can detect issues faster and improve customer experience.
The first step is identifying critical GraphQL operations and implementing continuous monitoring that verifies both availability and functionality.
Start Monitoring Your GraphQL APIs Today
Ready to detect GraphQL issues before customers notice them?
Start your 30-day Statixoup trial and configure your first GraphQL API monitor.
Monitor query execution, validate responses, track performance, and receive alerts when GraphQL services experience problems.