Monitoring as Code: Manage Uptime Checks Through CI/CD and APIs
A new service ships, the pipeline runs clean and three days later someone remembers nobody set up a monitor for it. Learn how monitoring as code closes that gap by provisioning checks automatically through CI/CD and APIs.
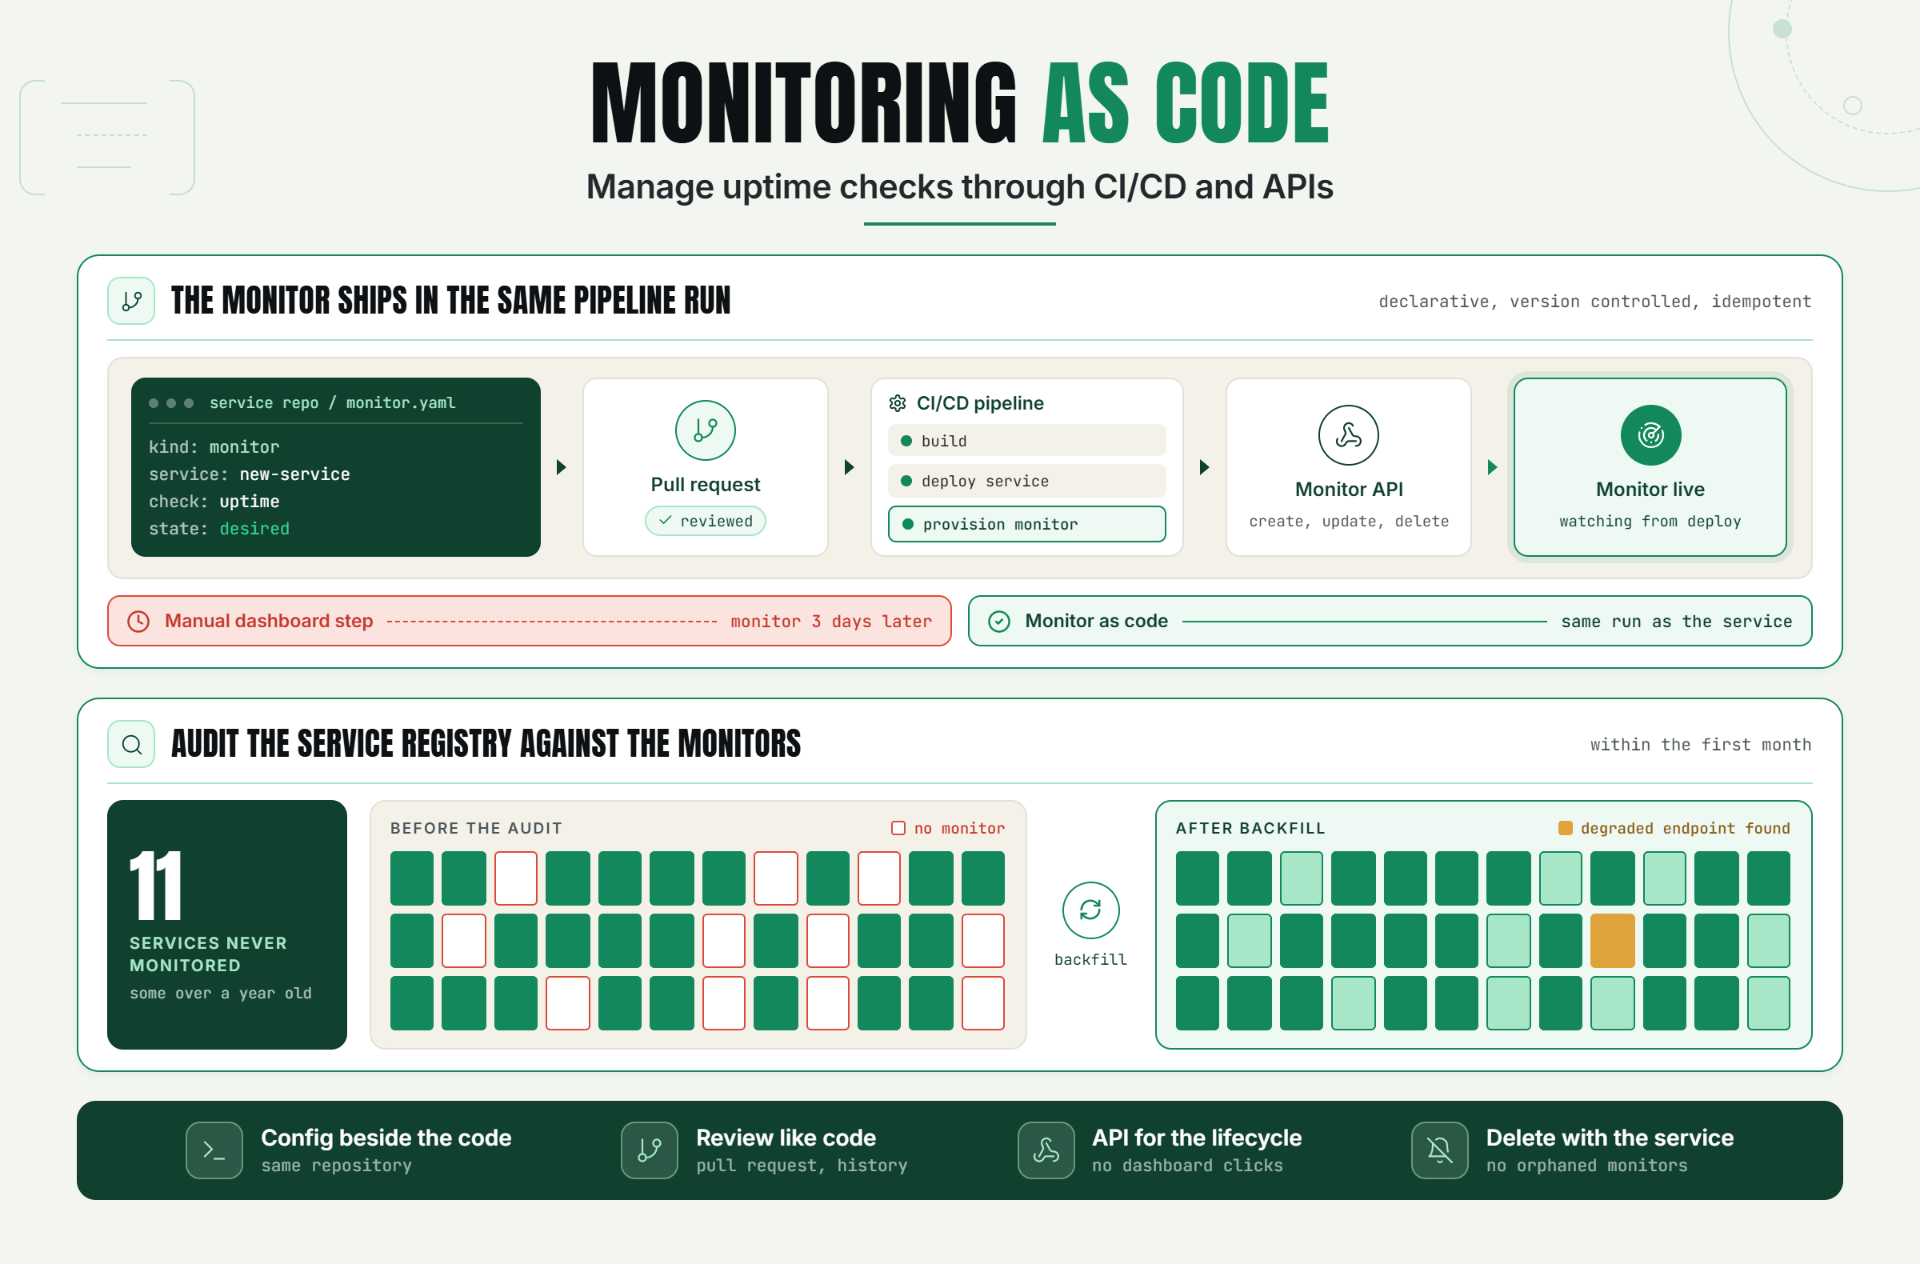
A new service ships. The deployment pipeline runs cleanly, the infrastructure provisions automatically, the DNS record updates itself through Terraform. And then someone remembers, three days later, that nobody actually set up a monitor for it because that step still lives entirely in a person's memory, not in the pipeline.
Monitoring as code treats monitor configuration the same way modern teams already treat infrastructure as something defined, versioned, and provisioned automatically, not clicked together manually in a dashboard after the fact. For teams running more than a handful of services, this isn't a nice to have convenience it's the difference between monitoring that scales with your infrastructure and monitoring that quietly falls further behind it every time something new ships.
Why Monitoring as Code Matters to Reliability and Customer Experience
Most teams that have already adopted infrastructure as code for servers, networking, and deployments still manage monitoring as a separate, manual afterthought someone logs into a dashboard, clicks through a form, and sets up a check by hand, sometimes as a deliberate final step, sometimes as an easily forgotten one.
This mismatch creates a specific and growing gap: your infrastructure scales automatically, but your monitoring coverage doesn't, unless a human remembers to keep up. Monitor provisioning through code closes that gap by making monitoring configuration a natural, automatic part of the same deployment process that provisions everything else, rather than a manual task that depends on someone's checklist discipline.
This matters for reliability because the services most likely to go unmonitored are exactly the ones deployed quickly, under time pressure, by teams moving fast precisely the conditions under which a manual "don't forget to add a monitor" step is most likely to get skipped.
The Operational Risk of Manual Monitor Management
Manually managed monitoring tends to accumulate the same category of problems as any manually managed configuration at scale:
- New services launch without corresponding monitors. Without an automatic, enforced step tying monitor creation to service creation, coverage depends entirely on someone remembering, which fails more often as deployment frequency increases.
- Configuration drifts between environments. A monitor manually configured for production may not get replicated correctly, or at all, for a new environment, staging setup, or regional deployment.
- Decommissioned services leave orphaned monitors behind. The reverse problem is just as real: a service gets shut down, but nobody remembers to remove its monitor, leading to false alerts on infrastructure that no longer exists.
- Monitoring configuration isn't reviewed the way code is. A manually clicked together monitor has no pull request, no review, and no change history, making it much harder to understand why a particular threshold or check was configured the way it was, or to safely modify it later.
At scale, this isn't a minor inconvenience. Organizations managing dozens or hundreds of services accumulate monitoring gaps and drift at a rate that manual processes simply can't keep pace with, and the specific gap that eventually causes a real incident is usually invisible until exactly the moment it matters.
How Monitoring as Code Works: Key Signals, Thresholds, and Diagnosis
The Core Pattern
Monitoring as code typically works through one of two closely related approaches: defining monitor configuration in version controlled files (often YAML or JSON) that get applied through a deployment pipeline, or calling a monitoring provider's API directly from within existing infrastructure as code tooling or CI/CD scripts. Both approaches share the same underlying goal: monitor configuration lives in the same version controlled, reviewed, automatically applied system as everything else being deployed.
Working With an Uptime Monitoring API
An uptime monitoring API allows monitor creation, modification, and deletion to happen programmatically rather than through manual dashboard interaction. This is the mechanical foundation that makes monitoring as code possible: a script or pipeline step can call the API to create a new monitor with the correct configuration, at the exact moment a new service is deployed, without requiring a human to remember or execute that step separately.
CI/CD Monitoring Configuration in Practice
CI/CD monitoring configuration typically means adding a step to an existing deployment pipeline that provisions or updates monitors alongside the actual service deployment. When a new service or endpoint is added to the deployment manifest, the same pipeline run that deploys it also creates the corresponding monitor, using the same version controlled configuration that defines everything else about that service.
Treating Monitors Like Infrastructure as Code
The core philosophical shift behind infrastructure as code applies directly to monitoring, configuration should be declarative (describing the desired end state, not a sequence of manual steps), version controlled (so changes are tracked and reviewable), and idempotent (applying the same configuration repeatedly produces the same result, without accumulating duplicate or conflicting monitors).
Key Signals for a Healthy Monitoring as Code Setup
| Signal | What It Indicates |
|---|---|
| Monitor count matches service count | No coverage gaps from services launched without corresponding monitors |
| Monitor configuration matches version controlled source | No manual, undocumented drift between what's deployed and what's defined in code |
| Orphaned monitors (no corresponding live service) | Decommissioning process isn't cleaning up monitoring alongside infrastructure |
| Time between service deployment and monitor creation | Whether monitoring is truly automated or still depends on a manual follow up step |
Diagnosis: Auditing Monitoring as Code Coverage
A periodic audit comparing your actual service inventory against your actual monitor inventory is the most direct way to catch drift: any service without a corresponding monitor represents a coverage gap, and any monitor without a corresponding live service represents cleanup debt left over from decommissioning.
A Practical Production Scenario
A platform team manages several dozen microservices, historically configuring monitors manually whenever a new service launched. As deployment frequency increases with a growing engineering team, monitor setup becomes an inconsistently followed step sometimes done immediately, sometimes forgotten for days, occasionally never done at all for smaller internal services.
The team adopts monitoring as code by adding a monitor definition file to each service's repository, using the monitoring provider's API to create or update the corresponding monitor as part of the same CI/CD pipeline that deploys the service itself. Monitor configuration now lives next to the service's own code, reviewed through the same pull request process as everything else.
Within the first month, an automated audit comparing the service registry against the monitor inventory reveals eleven existing services that had never had a monitor configured at all, some dating back over a year. Backfilling monitor configuration for these services immediately surfaces one already degraded endpoint that had been silently failing intermittently, with nobody previously aware because no monitor had ever been watching it.
Recommended Monitor Setup
- Define monitor configuration in version controlled files alongside each service's own codebase, rather than in a separate, disconnected system.
- Add a monitor provisioning step to the CI/CD pipeline that deploys the service, so monitoring is created automatically as part of deployment, not as a manual follow up.
- Use the monitoring provider's API for all monitor creation, modification, and deletion, rather than manual dashboard interaction, to keep configuration consistent and scriptable.
- Run a periodic audit comparing your service inventory against your monitor inventory to catch both coverage gaps and orphaned monitors.
- Tie monitor deletion to service decommissioning in the same pipeline or process, preventing orphaned monitors from accumulating over time.
Best Practices for Monitoring as Code
Store Monitor Configuration Alongside Service Code
Keeping monitor definitions in the same repository as the service they monitor makes the connection between the two explicit, reviewable, and much harder to accidentally forget.
Automate Monitor Provisioning as Part of Deployment
Tie monitor creation directly to service deployment through your CI/CD pipeline, so monitoring coverage scales automatically with your infrastructure instead of depending on a separate manual step.
Use the API for All Monitor Lifecycle Management
Creation, modification, and deletion should all happen programmatically wherever possible, ensuring monitoring configuration is as consistent, auditable, and version controlled as any other piece of infrastructure.
Audit Regularly for Drift and Orphaned Monitors
A scheduled comparison between your actual service inventory and your actual monitor inventory catches both missing coverage and leftover monitors from decommissioned services before either becomes a real problem.
Review Monitor Configuration Changes Like Code Changes
Running monitor configuration through the same pull request and review process as application code adds accountability and makes it easy to understand why a specific threshold or check exists.
Tie Monitor Decommissioning to Service Decommissioning
Whenever a service is retired, its corresponding monitor should be removed in the same process, preventing orphaned monitors from generating false alerts on infrastructure that no longer exists.
Common Mistakes in Monitoring as Code
Mistake 1: Treating Monitor Setup as a Manual, Separate Step
Why it happens: monitoring has traditionally been configured through a dashboard, making manual setup the path of least resistance.
What to do instead: integrate monitor provisioning directly into the same CI/CD pipeline that deploys the service, so coverage scales automatically with deployment frequency.
Mistake 2: Not Version Controlling Monitor Configuration
Why it happens: monitor settings configured through a dashboard don't naturally end up in a version control system.
What to do instead: define monitor configuration in files stored alongside service code, giving it the same review, history, and accountability as any other infrastructure configuration.
Mistake 3: Forgetting to Remove Monitors When Services Are Decommissioned
Why it happens: decommissioning checklists often focus on infrastructure and compute resources, overlooking monitoring cleanup.
What to do instead: tie monitor deletion to the same decommissioning process that retires the underlying service, preventing orphaned monitors from accumulating.
Mistake 4: Not Auditing for Coverage Gaps
Why it happens: without a deliberate audit process, missing monitor coverage is invisible until the exact moment it matters.
What to do instead: run periodic, automated comparisons between your service inventory and monitor inventory to catch gaps proactively.
Mistake 5: Managing Monitors Through a Mix of Manual and Automated Processes
Why it happens: teams sometimes automate provisioning for new services while leaving older, existing monitors managed manually, creating an inconsistent system.
What to do instead: migrate existing manually configured monitors into the same version-controlled, automated system, so the entire monitoring inventory follows one consistent process.
Mistake 6: Not Reviewing Monitor Configuration Changes
Why it happens: monitor threshold and configuration changes can feel less consequential than application code changes.
What to do instead: apply the same review process to monitor configuration changes as to any other infrastructure change, since a poorly considered threshold change can meaningfully affect alert reliability.
Start Provisioning Monitors the Same Way You Provision Everything Else
Every service your team ships already goes through an automated, reviewed, version-controlled deployment process. Monitoring deserves the same treatment, not a manual afterthought that depends on someone remembering.
Start a30 day Statixoup betaand configure monitor provisioning through the API as part of your existing CI/CD workflow. The next service you ship won't have to wait three days for someone to remember it needs a monitor.