Serverless Function Monitoring: Catch Cold Starts, Timeouts, and Missed Invocations
A cold function takes 4 seconds instead of 200ms on its next invocation and nothing logs it as an error. Learn how to catch cold starts, timeouts, and missed invocations that traditional monitoring can't see.
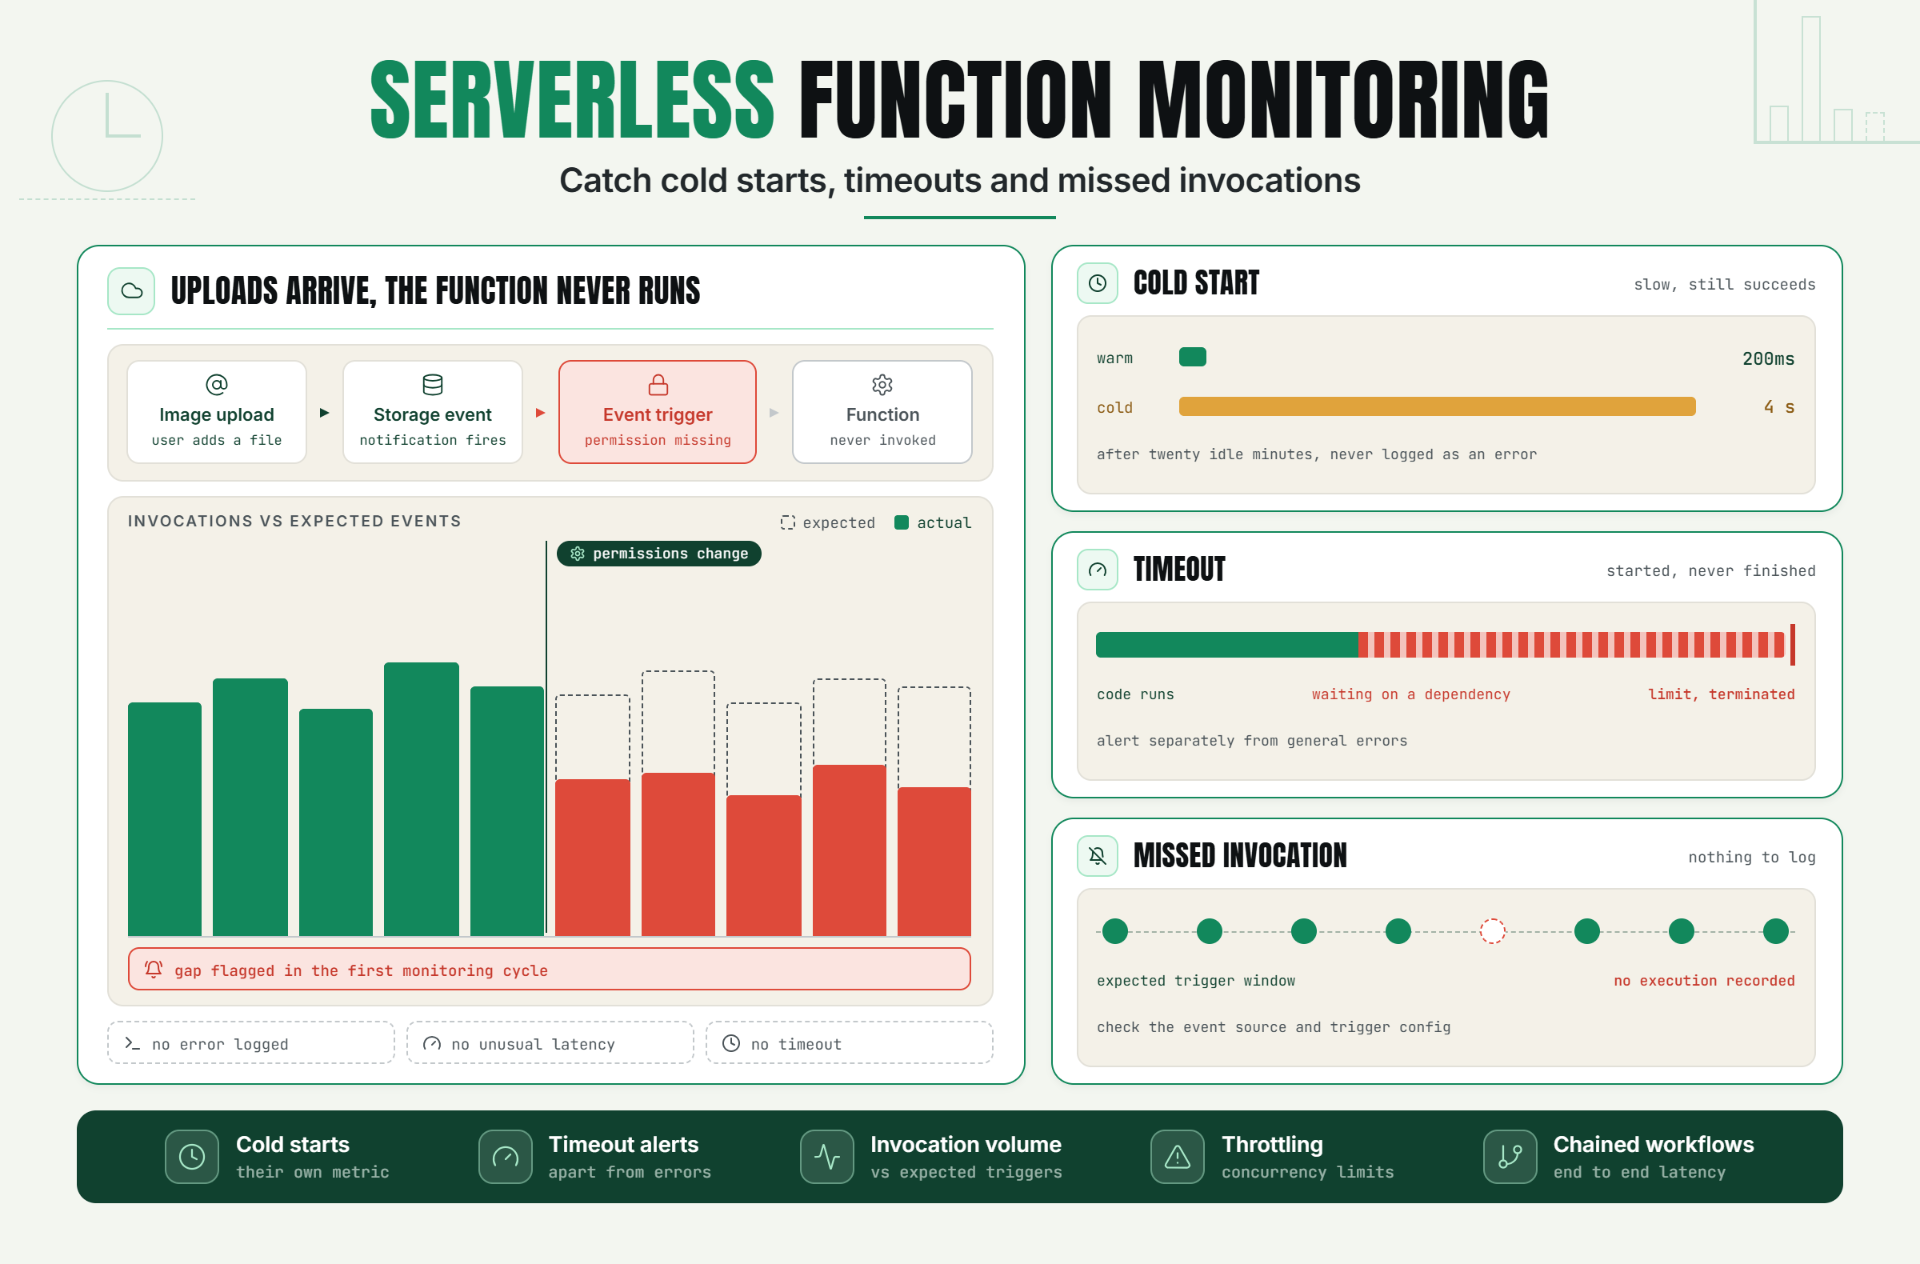
A function that hasn't run in twenty minutes suddenly takes four seconds to respond to its first invocation, instead of the usual 200 milliseconds. Nobody notices, because the function still technically succeeded. Multiply that four second delay across every customer who happens to trigger a cold start, and you have a real, recurring performance problem that never once shows up as an error in any log.
Serverless monitoring has to account for failure modes that simply don't exist in traditional server monitoring. There's no persistent process to check the liveness of. There's no fixed schedule guaranteeing regular invocation. A function can be technically "working" by every conventional measure while still delivering a meaningfully degraded experience, or in some cases, not running at all when it should have.
Why Serverless Monitoring Matters to Reliability and Customer Experience
Serverless functions are appealing precisely because they abstract away server management no persistent infrastructure to patch, scale, or keep running. But that same abstraction removes the traditional signals monitoring has always relied on. There's no server to ping, no consistently running process to check, and no predictable resource utilization pattern to watch for anomalies.
This means serverless availability has to be defined and measured differently than traditional uptime. A function is "available" if it invokes correctly, completes within an acceptable time, and produces the correct result, every time it's supposed to run, whether that's triggered by an HTTP request, an event, or a schedule. Each of those conditions can fail independently, and none of them necessarily produces a traditional, easily visible error.
For customer experience specifically, the risk is compounding, invisible latency and intermittent failures that are individually small but collectively significant, especially in architectures where many functions chain together to fulfill a single user facing request.
The Operational Risk of Under Monitored Serverless Functions
Serverless architectures introduce several specific failure patterns that traditional monitoring approaches aren't built to catch:
- Cold starts create inconsistent, invisible latency. When a function hasn't been invoked recently, the underlying platform needs to initialize a new execution environment before running the actual code, adding meaningful delay to that specific invocation, a delay that never shows up as an error and is easy to miss without dedicated tracking.
- Timeouts can occur without a clear, attributable cause. A function that usually completes well within its configured time limit can occasionally run long due to a slow downstream dependency, and get forcibly terminated by the platform, an outcome that looks different from a typical application error and is easy to overlook in generic error tracking.
- Missed or failed invocations are structurally hard to detect. If an event that should have triggered a function never does, due to a misconfigured trigger, a permissions issue, or an upstream failure, there's no natural error to catch, since the function was never even invoked in the first place.
- Traditional uptime checks don't map cleanly onto event driven, non HTTP functions. A function triggered by a queue message, a scheduled event, or a storage change doesn't have an obvious endpoint to "ping," making conventional uptime monitoring approaches a poor fit without adaptation.
Without monitoring built around these specific patterns, teams typically discover a serverless related degradation the way they discover most invisible failures: downstream, through a customer complaint about a slow or inconsistent experience, or through a business process that quietly stopped completing correctly, well after the underlying cause first appeared.
How Serverless Monitoring Works: Key Signals, Thresholds, and Diagnosis
Cold Start Monitoring
Cold start monitoring tracks the specific latency difference between a cold invocation (requiring environment initialization) and a warm one (reusing an already initialized environment). Tracking this as its own distinct metric, rather than folding it into a general response time average, makes it possible to see how often cold starts are occurring and how much latency they're actually adding, information a blended average tends to obscure.
Function Timeout Alerts
A function timeout alert should fire specifically when a function is terminated for exceeding its configured time limit, distinct from a general application error. Timeouts often point to a specific category of problem typically a slow or unresponsive downstream dependency that benefits from being diagnosed separately from a code-level bug causing an outright failure.
Detecting Missed Invocations
Since a missed invocation produces no execution and therefore no log entry to review, detecting this requires an external, independent signal: either a scheduled function check that verifies a time triggered function actually ran when expected, or monitoring the upstream event source itself to confirm events are being generated and successfully delivered to the function.
Monitoring for Platform Specific Functions
Lambda monitoring (or the equivalent for other cloud providers' serverless offerings) should track invocation count, error rate, duration, and throttling events as baseline signals, while also accounting for platform specific behaviors like concurrency limits, which can cause invocations to be throttled or delayed under sudden traffic spikes in ways that look different from a typical failure.
Key Signals to Track
| Signal | What It Catches |
|---|---|
| Cold start frequency and added latency | Inconsistent performance not visible in average response time alone |
| Timeout rate, tracked separately from general errors | Slow or unresponsive downstream dependencies |
| Invocation count vs. expected trigger volume | Missed invocations from misconfigured triggers or upstream failures |
| Concurrency throttling events | Functions being delayed or rejected due to concurrency limits under load |
| End to end latency for chained function workflows | Compounding delay across multiple functions fulfilling one user request |
Setting Thresholds
Thresholds for serverless functions benefit from being set relative to each function's own typical behavior rather than a single generic number, since cold start frequency and acceptable latency vary significantly based on a function's runtime, memory configuration, and how frequently it's invoked. A meaningful increase in timeout rate or cold start frequency relative to a function's own established baseline is generally a stronger signal than comparing against an unrelated function's numbers.
Diagnosis: Cold Start, Timeout, or Missed Invocation?
- Slow but successful invocation, especially after a period of inactivity likely a cold start; confirm by checking whether the delay correlates with time since the function's last invocation.
- Invocation started but didn't complete, terminated at the configured time limit a timeout; investigate the specific downstream dependency the function was waiting on at the time of termination.
- No invocation recorded at all during an expected trigger window a missed invocation; check the upstream event source or trigger configuration, since the function itself has nothing to log if it was never called.
A Practical Production Scenario
A SaaS platform uses a serverless function to process image uploads, triggered by a storage event whenever a user uploads a new file. The function generally performs well, with typical processing completing in under a second.
Following a routine update to the storage service's event notification configuration, a subset of upload events silently stop triggering the function due to a permissions change that wasn't fully propagated to the event trigger. Because no invocation ever occurs for these specific events, there's no error to review in the function's own logs, no unusual latency, and no timeout, simply a complete absence of expected activity for that subset of uploads.
Customers begin reporting that some uploaded images never appear as processed, though far from all of them, since the affected event type only represents a portion of total upload traffic. Because the team maintains a scheduled function check that periodically verifies invocation counts against expected event volume, the discrepancy between expected and actual invocations is flagged within the first monitoring cycle after the issue begins, well before it accumulated into a much larger backlog of unprocessed uploads.
Recommended Monitor Setup
- Track cold start frequency and latency as a distinct metric, separate from general average response time.
- Configure timeout specific alerts, distinguished from general error rate, to help isolate downstream dependency issues quickly.
- Compare actual invocation counts against expected trigger volume to catch missed invocations that produce no natural error signal.
- Monitor concurrency throttling events specifically, since these can silently delay or reject invocations under load without an obvious application level error.
- For functions chained together into a larger workflow, monitor end to end latency across the full chain, not just each function in isolation.
Best Practices for Serverless Function Monitoring
Track Cold Starts as Their Own Metric
Blending cold start latency into a general average response time obscures how often cold starts occur and how much delay they actually add, both of which matter for understanding real user facing performance.
Separate Timeout Alerts From General Error Alerts
A timeout usually points toward a slow or unresponsive dependency, a meaningfully different category of problem than a code level bug, and benefits from being diagnosed as such from the start.
Monitor Invocation Volume Against Expectation, Not Just Function Level Errors
Since a missed invocation produces no error to review, comparing actual invocation counts against expected trigger volume is often the only reliable way to catch this specific failure mode.
Set Thresholds Relative to Each Function's Own Baseline
Cold start frequency, typical duration, and acceptable latency vary meaningfully across functions depending on runtime and configuration, making a function's own historical baseline a more useful comparison point than a single blanket threshold.
Monitor Concurrency and Throttling Explicitly
Concurrency limits can cause invocations to be delayed or rejected under sudden load in ways that don't necessarily look like a typical application error, and deserve their own dedicated visibility.
Monitor End to End Latency for Chained Serverless Workflows
When multiple functions work together to fulfill a single user facing request, monitoring only individual function performance can miss compounding delay that only becomes visible when measured across the full chain.
Common Mistakes in Serverless Function Monitoring
Mistake 1: Blending Cold Start Latency Into General Average Response Time
Why it happens: it's simpler to track one combined response time metric than to separate cold and warm invocations.
What to do instead: track cold start frequency and latency as a distinct signal, since blending it into an average obscures both how often it happens and how much delay it adds.
Mistake 2: Treating Timeouts the Same as General Application Errors
Why it happens: both show up as a failed invocation, making them easy to group together.
What to do instead: configure a distinct function timeout alert, since timeouts often point toward a specific category of problem typically a slow dependency worth diagnosing separately.
Mistake 3: Not Monitoring for Missed Invocations at All
Why it happens: a missed invocation produces no natural error or log entry, making it easy to overlook without a dedicated check.
What to do instead: compare actual invocation counts against expected trigger volume, or run a scheduled function check for time triggered functions, to catch this failure mode that otherwise leaves no trace.
Mistake 4: Using Generic, One Size Fits All Thresholds Across Different Functions
Why it happens: a single shared threshold is simpler to configure than function specific baselines.
What to do instead: set thresholds relative to each function's own typical behavior, since cold start frequency and acceptable latency vary meaningfully based on runtime and invocation pattern.
Mistake 5: Not Monitoring Concurrency Throttling
Why it happens: throttling events don't always look like a typical application error, making them easy to overlook.
What to do instead: monitor concurrency limits and throttling explicitly, since these can silently delay or reject invocations under load without triggering conventional error alerts.
Mistake 6: Only Monitoring Individual Functions in Isolation
Why it happens: it's simpler to monitor each function separately than to track a full workflow spanning multiple functions.
What to do instead: monitor end to end latency across chained serverless workflows, since compounding delay across multiple functions can be invisible when each one is only measured on its own.
Start Monitoring What Traditional Tools Can't See
Serverless functions fail in ways that don't leave the usual traces a cold start with no error, a timeout with an ambiguous cause, an invocation that simply never happened. Traditional monitoring approaches built around persistent servers weren't designed to catch any of this.
Start a 30 day Statixoup beta and configure monitoring built specifically for serverless reliability, covering cold starts, timeouts, and invocation volume. The next silent degradation won't get to hide behind a function that technically didn't throw an error.