Website Uptime Percentage: How to Calculate 99.9%, 99.99%, and Error Budgets
Website uptime percentage measures service availability. Learn how to calculate 99.9%, 99.99%, and 99.999% uptime, understand error budgets, and track reliability with real examples.
Website uptime percentage is one of the simplest ways to measure how consistently a website or service remains available to users. It is commonly expressed as a percentage, such as 99%, 99.9%, or 99.99%.
For SaaS founders, engineering managers, SRE teams, and procurement stakeholders, uptime percentages are more than numbers in a report. They can help define reliability expectations, compare service-level commitments such as SLAs, SLOs and SLIs, plan monitoring strategies, and understand how much downtime a service can tolerate.
Even a small difference between 99.9% and 99.99% can represent a meaningful difference in allowable downtime. Understanding these numbers makes it easier to set realistic targets and connect monitoring results to business requirements. The real cost of website downtime can include lost revenue, reduced productivity, support costs and damaged customer trust.
The Operational Risks Teams Face Without Effective Website Uptime Percentage
Without a clear uptime target, teams may struggle to determine whether their website or application is reliable enough for customers and business requirements.
Common operational risks include:
- Unclear reliability expectations: Teams may not agree on what level of availability is acceptable.
- Unexpected downtime: Small incidents can accumulate without anyone understanding their impact on the overall SLA uptime target.
- Poor incident prioritization: Without defined thresholds, engineering teams may not know which incidents require immediate attention.
- Customer dissatisfaction: Repeated outages can reduce trust and negatively affect the customer experience.
- Contractual risk: Enterprise customers may have specific availability requirements written into contracts or SLAs.
- Uncontrolled engineering trade-offs: Teams may prioritize new features without considering the remaining reliability budget.
A defined website uptime percentage provides a measurable target that can be tracked through uptime monitoring and reporting.
How Website Uptime Percentage Works
Website uptime percentage represents the proportion of a measurement period during which a website or service is considered available.
A simple formula is:
Uptime Percentage = (Total Time - Downtime) / Total Time x 100
For example, if a service is available for 999 minutes out of 1,000 minutes:
(1,000 - 1) / 1,000 x 100 = 99.9%
The exact calculation can vary depending on how availability is defined, which events count as downtime, and whether scheduled maintenance is excluded.
What Does 99% Uptime Mean?
99% uptime means the service is available for approximately 99% of the measurement period and unavailable for the remaining 1%.
For a 30-day month, this represents approximately:
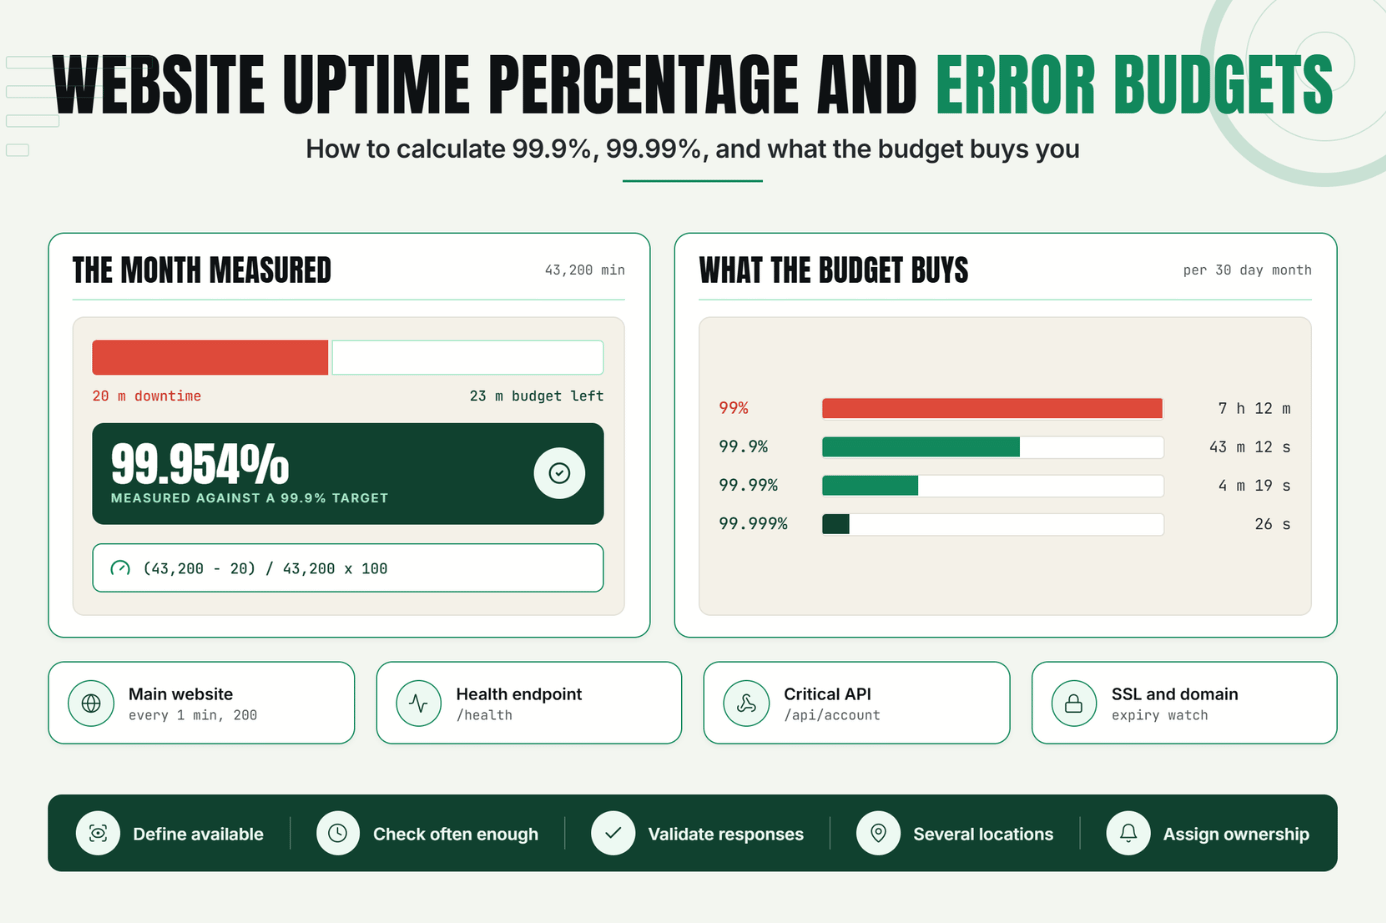
7 hours 12 minutes of downtime
This may be acceptable for some non-critical services but could be too much for a customer-facing SaaS platform.
What Does 99.9% Uptime Mean?
99.9 uptime, often called “three nines,” allows approximately:
- 43 minutes 12 seconds of downtime per 30-day month
- 8 hours 45 minutes 36 seconds per year
This is a common availability target, but whether it is sufficient depends on the service and its business impact.
What Does 99.99% Uptime Mean?
99.99% uptime, often called “four nines,” allows approximately:
- 4 minutes 19 seconds of downtime per 30-day month
- 52 minutes 33 seconds per year
The difference between 99.9% and 99.99% may look small mathematically, but the operational expectations are significantly different.
Uptime Percentage and Downtime Allowance
Downtime allowance is the amount of downtime permitted by a specific uptime target during a defined period.
| Uptime Target | Downtime per 30-Day Month | Downtime per Year |
|---|---|---|
| 99% | 7 hours 12 minutes | 3 days 15 hours 36 minutes |
| 99.9% | 43 minutes 12 seconds | 8 hours 45 minutes 36 seconds |
| 99.99% | 4 minutes 19 seconds | 52 minutes 33 seconds |
| 99.999% | 26 seconds | 5 minutes 15 seconds |
These figures assume continuous availability measurement and a 365-day year. Actual contractual calculations may use different definitions, measurement windows, or exclusions.
Using an Uptime Calculator
An uptime calculator can make it easier to convert an availability target into a practical downtime allowance.
For example, to calculate downtime allowed for 99.9% uptime:
Downtime = Total Period x (1 - 0.999)
For a 30-day month:
30 x 24 x 60 x 0.001 = 43.2 minutes
This calculation helps teams understand what an uptime target actually means operationally.
What Is an Error Budget?
According to Google's error-budget guidance, an error budget is the amount of unreliability a service can experience while remaining within its reliability target.
For example, if your SLA uptime target is 99.9%, your availability error budget is approximately 0.1% of the measurement period.
This concept allows engineering teams to balance reliability and product development.
If a service is well within its reliability target, the team may have more flexibility to release changes. If the service has consumed most of its error budget, the team may prioritize reliability work instead.
Signals, Thresholds, and Diagnosis
Calculating uptime requires reliable signals. Monitoring systems typically collect information such as:
- Successful requests
- Failed requests
- HTTP status codes
- Response times
- Connection timeouts
- DNS failures
- SSL/TLS problems
- Application-level validation results
Teams can then define thresholds for determining when a service should be considered unavailable or degraded.
For example, an organization may define a failed availability check when an HTTP endpoint returns an unexpected status code or fails to respond within a configured timeout.
A Realistic Production Scenario and Recommended Monitor Setup
Consider a SaaS application used by customers throughout the day. The business wants to maintain a 99.9% monthly uptime target.
The team can translate that target into a measurable downtime allowance of approximately 43 minutes per 30-day month.
A practical monitoring setup could include:
Monitor 1: Main Website
- Monitor type: HTTP
- Frequency: Every 1 minute
- Expected status: 200
- Validation: Expected page content
- Alert condition: Consecutive failed checks
Monitor 2: Application Health Endpoint
- Endpoint:
/health - Expected status: 200
- Validation: Expected response structure
- Purpose: Detect application-level availability problems
Monitor 3: Critical API
Monitor an API that represents an important customer workflow.
For example:
GET /api/account Track:
- HTTP status
- Response time
- Response content
- Failure rate
Monitor 4: SSL and Domain Health
Monitor SSL certificate expiration and domain-related availability issues so that preventable failures do not consume the service's downtime allowance.
Turning Monitoring Data Into Uptime Reports
Monitoring data can be aggregated over a defined period to calculate actual availability.
For example, if a service experienced 20 minutes of qualifying downtime during a 30-day month:
Uptime = (43,200 - 20) / 43,200 x 100
This produces an uptime percentage of approximately 99.954%.
Because the actual availability is above the 99.9% target, the service remains within the target for that measurement period.
Best Practices: Coverage, Check Frequency, Validation, Ownership, and Escalation
1. Define Availability Clearly
Before calculating uptime, define what “available” means.
Document:
- Which endpoints are included
- What counts as downtime
- Which status codes indicate failure
- Whether scheduled maintenance is excluded
- How partial outages are handled
2. Monitor Critical Services
Don't calculate uptime using only a low-value page if customers depend on several services.
Prioritize critical customer-facing functionality and important APIs.
3. Choose an Appropriate Check Frequency
Check frequency should align with your reliability objectives.
If your downtime allowance is only a few minutes per month, checks that run infrequently may not provide enough detection coverage.
4. Validate Responses
A successful HTTP status alone may not prove that an application is working correctly.
Where appropriate, validate response content, response structure, and performance thresholds.
5. Monitor From Multiple Locations
Multiple monitoring locations can help identify regional availability problems and reduce the risk of relying on a single network path.
6. Assign Ownership
Every important monitor should have an owner responsible for responding to alerts and investigating recurring problems.
7. Connect Uptime to Error Budgets
Don't treat the uptime percentage as a reporting-only metric. Use the error budget to guide engineering decisions. Google Cloud explains how service-level indicators and objectives can be measured over a defined compliance period.
If the service has consumed most of its available budget, reliability improvements may need to take priority over non-critical releases.
Common Mistakes: Weak Checks, Noisy Alerts, Missing Dependencies, and Poor Routing
Mistake 1: Choosing an Uptime Target Without Business Context
Not every service requires five nines of availability.
Better approach: Choose an uptime target based on customer expectations, business impact, technical requirements, and cost.
Mistake 2: Confusing Uptime With Performance
A website can technically be available while being extremely slow.
Better approach: Track availability and performance as related but distinct reliability signals.
Mistake 3: Relying on a Single Monitor
A single endpoint may not represent the health of the entire application.
Better approach: Monitor critical pages, APIs, and customer-facing workflows.
Mistake 4: Ignoring Dependencies
Your website may remain reachable while a critical third-party service is failing.
Better approach: Identify important dependencies and understand how their failures affect customer availability.
Mistake 5: Creating Noisy Alerts
Too many alerts can cause teams to ignore important notifications.
Better approach: Use sensible thresholds, consecutive failures, severity levels, and clear routing.
Mistake 6: Treating an SLA as a Guarantee of Zero Downtime
An SLA uptime target defines an availability commitment and its measurement rules. The Amazon Compute Service Level Agreement is a real-world example of how monthly uptime, unavailability and service credits can be defined contractually. It does not mean outages can never happen.
Better approach: Use SLA targets together with monitoring, incident response, and error-budget practices.
Make Your Uptime Target Measurable
Website uptime percentage turns an abstract reliability goal into a measurable target. Understanding the difference between 99%, 99.9%, 99.99%, and higher availability levels helps teams set realistic expectations and understand their available downtime.
For engineering teams, uptime becomes even more useful when combined with monitoring, clear alerting, ownership, and error budgets. Instead of simply reporting availability after an incident, teams can use reliability data to make better operational and product decisions.
The first step is simple: identify your most important customer-facing service, define its availability target, and configure a monitor that continuously checks whether it meets that target.
Start Monitoring Your Website
Ready to turn your uptime target into measurable reliability?
Start your 30-day Statixoup trial and configure your first monitor. Set up monitoring for your critical website or API, track availability, and get actionable alerts when your service approaches or exceeds its defined thresholds.