MTR vs Traceroute: Find the Real Network Problem Fast
MTR and traceroute both trace the path your packets take, but only MTR keeps re-probing each hop over time, turning a one-time snapshot into real evidence of where latency and packet loss are actually happening.
So where did the extra 760 milliseconds come from?
This is exactly where MTR vs traceroute becomes useful.
For network engineers and DevOps teams, Statixoup's monitoring goal isn't simply to prove that an endpoint went slow or offline. The useful evidence is what happened on the path to that endpoint: whether latency increased, packets disappeared, the route changed, or a particular network segment started behaving differently.
The short answer is simple. Traceroute shows the path packets are likely taking at one point in time. MTR combines path discovery with repeated probes, giving you running latency and loss information for each visible hop. That makes traceroute useful for quickly inspecting a route, while MTR is usually stronger when you need evidence of an intermittent or persistent network problem. MTR's own documentation describes it as combining traceroute-style route discovery with ongoing measurements for the hops it sees.
There is one catch.
A scary-looking percentage beside an intermediate router doesn't automatically prove that router is dropping your customer traffic.
That's the mistake worth avoiding.
The Operational Problem: An Endpoint Alert Doesn't Tell You Why
Basic uptime monitoring answers an important question:
Can I reach the service?
It doesn't necessarily answer the next one:
Why is it slow from this location?
Suppose an HTTP monitor reports a 2.4-second response time. That delay could come from the application, DNS resolution, TLS setup, congestion near the destination, an upstream ISP, a routing change, or packet retransmissions caused by actual network loss.
Those are very different incidents.
Without network-path evidence, teams often end up debugging the component they control first. Application engineers check code. Database engineers check queries. Infrastructure teams inspect CPU, memory, and load balancers.
Meanwhile, the routing issue sits somewhere between the probe and the server.
This is why MTR vs traceroute isn't just a command-line-tool comparison. It's really a question of how much evidence you want when the network behaves badly.
How MTR vs Traceroute Actually Works
Traceroute and MTR rely on a simple property of IP networking: the Time To Live field.
Each router forwarding an IPv4 packet decreases its TTL. When TTL reaches zero, the router discards the packet and may return an ICMP Time Exceeded response. RFC 792 defines that Time Exceeded behavior.
Traceroute exploits this by starting with a low TTL and increasing it.
A simplified sequence looks like this:
- Send a probe with TTL 1.
- Record the router that reports TTL expiration.
- Send another probe with TTL 2.
- Record the next router.
- Continue increasing TTL until the destination responds or the maximum hop count is reached.
The traceroute documentation notes a default maximum of 30 hops in the Linux implementation.
That produces something resembling:
1 10.0.0.1 1 ms2 203.0.113.1 6 ms3 198.51.100.14 18 ms4 198.51.100.61 22 ms5 192.0.2.80 91 ms6 api.example.com 94 ms Useful? Absolutely.
But it's a snapshot.
What MTR Adds to Traceroute
MTR vs traceroute starts to separate when time becomes part of the diagnosis.
MTR repeatedly probes the network path instead of producing only one route snapshot. Its output can include measurements such as packets sent, loss percentage, latest round-trip time, average latency, best latency, worst latency, and standard deviation. The MTR project documents running per-hop statistics while it continues probing the destination.
A report might look conceptually like this:
| Hop | Loss | Avg | Best | Worst |
|---|---|---|---|---|
| Gateway | 0% | 1 ms | 1 ms | 3 ms |
| ISP edge | 0% | 7 ms | 5 ms | 18 ms |
| Transit A | 0% | 21 ms | 17 ms | 40 ms |
| Transit B | 8% | 87 ms | 61 ms | 180 ms |
| Destination | 8% | 91 ms | 65 ms | 188 ms |
Now you have something different.
You aren't only asking, "Which router did this packet cross?"
You're asking, "What happened repeatedly while traffic crossed this path?"
That's far more useful for network latency diagnosis.
MTR vs Traceroute: Snapshot Versus Pattern
A useful mental model is:
| Capability | Traceroute | MTR |
|---|---|---|
| Discover visible path | Yes | Yes |
| Quick one-time diagnosis | Strong | Strong |
| Repeated measurements | Limited | Strong |
| Per-hop loss indication | Limited | Yes |
| Average latency | Limited | Yes |
| Worst/best latency | Limited | Yes |
| Spot intermittent behavior | Weak from one run | Much stronger |
| Long-term monitoring evidence | Requires repeated collection | Better suited |
Neither command sees the network with perfect accuracy.
That's important.
Internet routes aren't guaranteed to remain static. A 2026 traceroute-based study analyzed five years of path observations spanning six large ISPs, 20 autonomous systems, and 14 countries. The researchers found that paths between endpoints can change and that traffic doesn't always follow the geographically shortest route.
One clean traceroute at 09:03 doesn't prove the 09:17 incident used exactly the same path.
Which is why historical measurements matter.
Packet Loss Monitoring: Don't Blame the First Red Number
Here's where MTR output gets misread.
Imagine this:
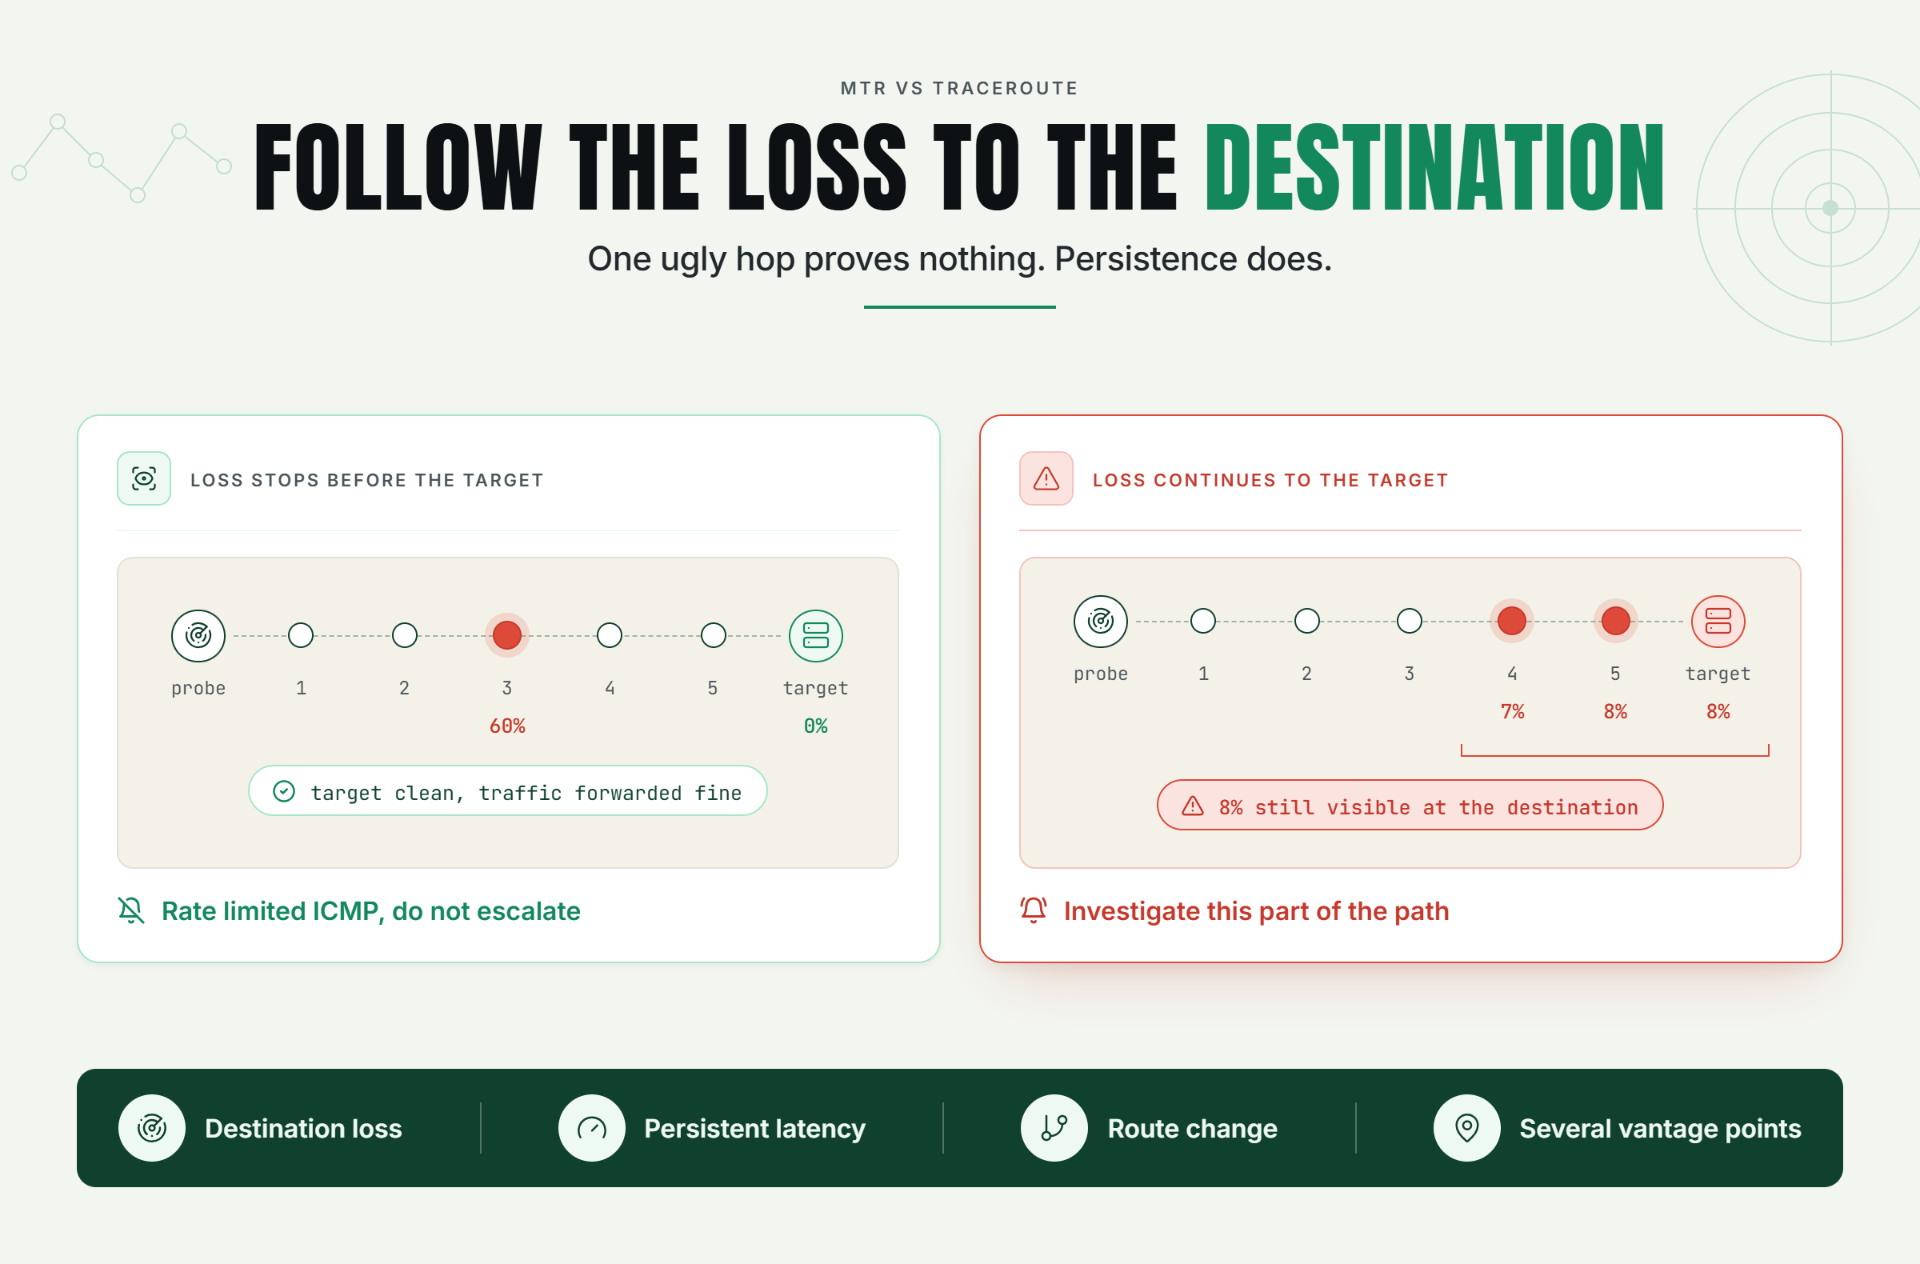
Hop 1 0% lossHop 2 0% lossHop 3 60% lossHop 4 0% lossHop 5 0% lossTarget 0% loss Is hop 3 destroying 60% of your traffic?
Probably not.
If hop 3 were genuinely dropping 60% of the packets it forwards, later hops would normally show the effect too. Instead, hop 3 may simply be responding to diagnostic traffic less reliably than it forwards production traffic.
The MTR project explicitly warns about this. Intermediate routers may suppress or rate-limit ICMP responses, so apparent loss at one intermediate hop doesn't necessarily represent forwarded traffic being dropped there.
The Linux MTR manual goes further, noting that some modern routers give ICMP Echo packets lower priority than other traffic. Their apparent reliability in MTR can therefore look worse than their real forwarding reliability.
This is one of the most important rules in packet loss monitoring:
Look for loss that continues toward the destination.
When Packet Loss Becomes Convincing
Consider this instead:
Hop 1 0%Hop 2 0%Hop 3 0%Hop 4 7%Hop 5 8%Hop 6 8%Target 8% That's more interesting.
The problem appears at hop 4 and remains visible afterward, including at the destination.
It still isn't courtroom-level proof that hop 4 is physically defective. Paths can be asymmetric, load-balanced, or represented imperfectly by diagnostic probes.
But now you have a much stronger lead.
A Better Rule for MTR Diagnostics
If an intermediate hop reports loss but the destination doesn't, treat it cautiously.
If loss begins at one point and continues through subsequent hops to the destination, investigate that part of the path.
And if only the destination shows loss, don't automatically blame the final router. Check destination-side filtering, load, firewall behavior, and the protocol being tested.
Latency Is About Where the Delay Persists
The same reasoning applies to latency.
Say your MTR shows:
Hop 1 1 msHop 2 8 msHop 3 11 msHop 4 140 msHop 5 22 msTarget 24 ms Hop 4 looks awful.
But the destination doesn't.
That can happen when a router is slow to generate diagnostic responses while forwarding ordinary packets normally.
Now compare it with:
Hop 1 1 msHop 2 8 msHop 3 11 msHop 4 139 msHop 5 143 msTarget 146 ms Different story.
The latency increase appears at hop 4 and survives through the rest of the route.
That's evidence worth investigating.
This is why MTR vs traceroute should be interpreted end to end, not hop by hop in isolation.
Traceroute Monitoring Can Reveal Route Changes
Latency and loss aren't the only signals.
Sometimes the route itself changes.
Yesterday, traffic may have crossed one transit provider. Today, BGP policy or upstream connectivity sends it somewhere else. Your service stays online, but customers in one region suddenly gain another 80 ms of round-trip latency.
An application monitor can show the slowdown.
A stored traceroute can show what changed.
This is where traceroute monitoring becomes valuable even if you're also using MTR. Retaining route evidence lets engineers compare the path before, during, and after an incident.
The route isn't guaranteed to be identical probe to probe. Load balancing can expose different hops, and return traffic can use a different path entirely.
Still, historical path evidence is useful.
A routing incident becomes much easier to escalate when the report says:
"Latency increased by 96 ms at 14:22 UTC"
and
"The visible path changed from transit provider A to transit provider B at approximately the same time."
That's far stronger than:
"The site felt slow."
A Practical MTR vs Traceroute Production Scenario
Consider an illustrative production incident.
A SaaS platform runs its API in Frankfurt. Most European monitoring locations report normal response times around 80 to 110 ms.
One probe location begins reporting 480 to 700 ms.
The API is healthy.
CPU is 34%.
Database query time hasn't changed.
Requests from other regions remain normal.
First Check: Traceroute
An engineer runs traceroute from the affected location.
The route reaches the expected destination, but traffic appears to pass through a different upstream network than yesterday.
Interesting.
Not enough.
One trace doesn't tell you whether the route is consistently slow.
Second Check: MTR Diagnostics
Now the team runs an MTR report over a larger sample.
The first several hops remain stable.
Then average latency jumps from roughly 30 ms to more than 300 ms at the transition into an upstream network. The elevated latency continues through subsequent hops and reaches the destination.
That persistence is the key.
There's no need to invent a dead router.
The evidence supports a narrower conclusion: the degraded performance begins around that network transition and persists to the destination.
Now the team can compare results from another geographic probe.
That second probe takes a different path and remains fast.
At this point, the incident report has useful evidence:
- application health is normal;
- the issue is location-dependent;
- MTR shows persistent latency beginning in a particular section of the route;
- traceroute shows a route difference from the known-good path;
- another monitoring location doesn't reproduce the problem.
That's an escalation packet an upstream provider can work with.
Recommended Monitor Setup
For a production service, don't rely on one probe.
A stronger setup is:
- Monitor the endpoint from several geographically meaningful locations.
- Track normal application response time separately from network-path measurements.
- Capture traceroute evidence when latency or availability changes materially.
- Run repeated MTR-style diagnostics long enough to distinguish one noisy response from a pattern.
- Save the results with the incident timestamp.
- Compare the failing path with a healthy location.
- Escalate using destination-visible loss or persistent latency, not one ugly intermediate hop.
The result is evidence you can compare rather than a screenshot someone grabbed after the problem disappeared.
Best Practices for MTR vs Traceroute Monitoring
Use More Than One Vantage Point
A network problem can be regional.
One probe tells you what one source experienced.
Three or five intelligently placed probes tell you whether the failure is local, regional, provider-specific, or destination-wide.
That distinction matters when deciding who owns the incident.
Establish a Baseline Before Something Breaks
A trace captured during the incident is useful.
A trace captured during the incident plus a known-good baseline is much better.
Keep enough historical evidence to answer:
- Did the route change?
- Which hop introduced persistent latency?
- Is packet loss new?
- Is the issue limited to one probe?
- Does the destination show the same degradation?
Don't Alert on Every Intermediate Hop
This creates noise fast.
Remember that routers can rate-limit ICMP responses. The traceroute manual also warns that sending many simultaneous probes can cause responses to be lost because routers or hosts throttle ICMP.
Alert on symptoms that matter to the service.
Destination loss matters.
Persistent end-to-end latency matters.
Repeated route changes may matter.
One intermediate router declining to answer half your diagnostic probes often doesn't.
Match the Probe Protocol to the Service
Classic tests frequently use ICMP or UDP, but production applications may depend on TCP to a specific service port.
MTR supports alternative probe modes including UDP and TCP SYN.
If ICMP looks suspicious while customers report a TCP problem, compare protocols.
The question isn't "Which protocol is universally best?"
It's "Which measurement most closely represents the path my users depend on?"
Define Ownership Before the Alert Fires
A perfect diagnostic report is useless if nobody knows who acts on it.
Decide in advance:
- what the NOC owns;
- what DevOps owns;
- when the hosting provider is contacted;
- when an ISP ticket is opened;
- what evidence must be attached;
- how long degradation must persist before escalation.
That turns MTR diagnostics into an operational process instead of a command someone remembers during an outage.
Common MTR and Traceroute Mistakes
Mistake 1: Treating Every Lost ICMP Reply as Packet Loss
Why it happens: the Loss% column looks authoritative.
What to do instead: check whether the loss continues through later hops and reaches the destination.
Mistake 2: Blaming the Hop With the Highest RTT
Why it happens: engineers naturally focus on the largest number.
What to do instead: determine whether the latency increase persists afterward.
If the next hop returns to normal, the slow response may be about control-plane processing rather than packet forwarding.
Mistake 3: Running One Trace After the Incident
Why it happens: traceroute is easy to run manually.
What to do instead: capture path evidence during the incident and keep baseline data for comparison.
A healthy path ten minutes later may tell you almost nothing about what happened.
Mistake 4: Monitoring From One Location
Why it happens: one check is cheaper and simpler.
What to do instead: use several meaningful vantage points when customer experience spans providers or regions.
One network path isn't the Internet.
Mistake 5: Escalating Without Context
An upstream provider needs more than:
"Hop 8 has 40% loss."
Provide timestamps, source location, destination, protocol, repeated measurements, destination-level impact, and a comparison with another location if possible.
That saves everyone time.
The Main Takeaway
The hardest network incidents aren't the ones where everything is completely down.
They're the ones where the application works, but only slowly. Or only from Mumbai. Or only through one ISP. Or only for seven minutes every afternoon.
That's where MTR vs traceroute earns its place.
Traceroute tells you what the visible path looks like. MTR adds repeated measurements that help distinguish a route from a pattern. Neither should be interpreted by staring at one intermediate hop.
Follow the problem to the destination.
If latency starts at one point and stays high afterward, investigate it. If packet loss starts at one point and remains visible at the destination, investigate it. If an intermediate router looks terrible while every later hop is healthy, don't open a provider ticket based on that line alone.
Better evidence means shorter arguments during incidents.
And usually, faster diagnosis.
Start Building Better Incident Evidence
A simple uptime alert tells you that something changed.
Network-path evidence helps explain where it changed.
Start a 30-day Statixoup trial, configure the relevant monitor, and build MTR and traceroute evidence into your network incident workflow. When the next latency spike or packet-loss report arrives, you'll have more than a red alert.
You'll have something your engineers can investigate.
Post a Comment

Hardik Vaghani
Hardik Vaghani is a Digital Marketing Professional and SEO Strategist based in Surat, Gujarat, India. He currently works with Ethnic Infotech, contributing to SEO, content marketing, technical SEO, and digital growth strategies. Hardik also creates blog content for Fusion5, focusing on technology, laptops, and consumer electronics. With expertise in SEO, Google Ads, Meta Ads, Local SEO, and Content Strategy, he helps businesses improve online visibility, rankings, and lead generation through data-driven marketing.
Frequently Asked Questions
Related Blogs