How to Monitor JavaScript Heavy Websites and Single Page Applications for Real Uptime
A 200 status code doesn’t always mean your website is working properly. Learn why traditional uptime monitoring can miss issues in React, Vue, and other JavaScript heavy apps and how to monitor them effectively.
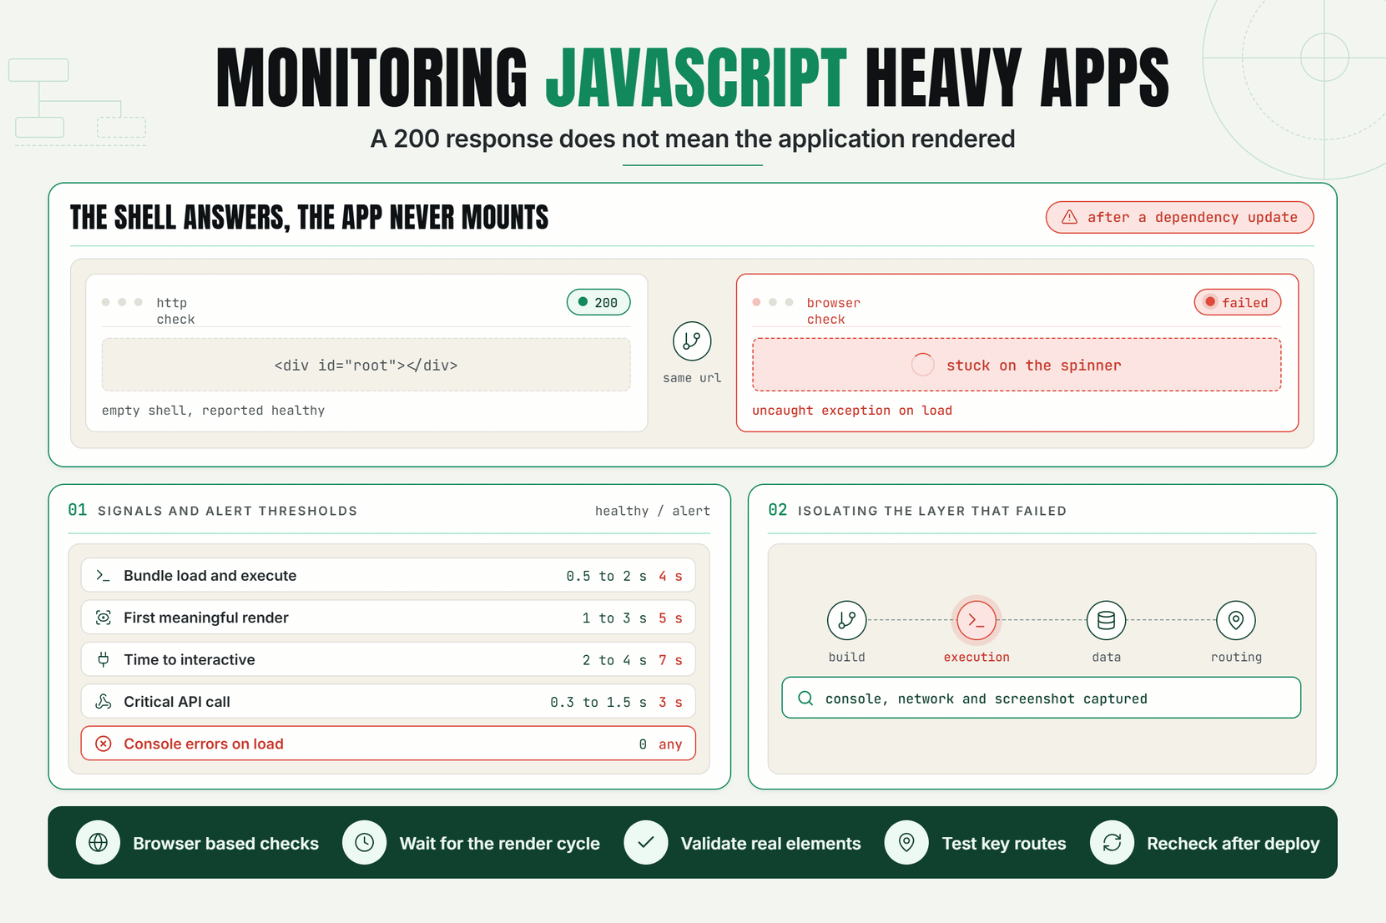
A basic uptime check pings your homepage, gets a 200 response, and calls it healthy.
For a React, Vue, or Angular application, that response might just be an empty <div id="root"></div> the actual application hasn't rendered anything yet. The real page, the one your users see and interact with, only exists after JavaScript executes, data loads, and components mount. A traditional monitor has already given up before any of that happens.
This is the core challenge behind SPA monitoring: single page applications don't serve finished HTML the way traditional websites do, so monitoring them requires a fundamentally different approach than checking whether a URL responds.
Why SPA Monitoring Matters to Reliability and Customer Experience
Single page applications shifted a huge share of the work from the server to the browser. Routing, rendering, data fetching, and state management all happen client side, after the initial page load. That architecture is great for user experience once it works but it also means the server has far less visibility into whether the application actually functions.
A traditional JavaScript website monitoring setup that only checks HTTP status codes is checking the wrong layer entirely. The server can return a perfectly valid response containing almost no visible content, while the client side application that's supposed to render on top of it fails silently a broken API call, an unhandled promise rejection, a component that throws and never mounts.
This matters for single page application uptime because the definition of "up" has to change. A traditional site is up if the server responds. An SPA is only meaningfully up if the JavaScript bundle loads, executes without fatal errors, fetches its data successfully, and renders the interface a user actually needs.
The Operational Risk of Monitoring SPAs Like Traditional Websites
Teams that apply traditional uptime monitoring to a modern frontend typically end up with a dashboard that says everything is fine while the application is actually broken for real users. This happens for a few structural reasons:
- The initial HTML is often nearly empty. Most SPA frameworks serve a minimal shell and build the actual UI client side, so a raw HTML check has almost nothing meaningful to validate.
- Failures are frequently client side only. A broken build, a failed API call, or an uncaught JavaScript exception can prevent the app from rendering, without the server ever returning anything other than a 200.
- Routing happens in the browser, not the server. A broken client side route can leave a user on a blank screen while the server level URL responds normally, since the server isn't the one deciding what renders.
- Third party and API dependencies matter more. SPAs typically make heavy use of client side API calls; if those calls fail or time out, the interface can break even though every server involved is technically healthy.
Without monitoring built for this architecture, teams typically find out about frontend availability problems the same way they find out about any invisible failure: user complaints, a spike in error tracking tool volume, or a manual QA pass that happens to catch it usually well after real users already have.
How SPA Monitoring Works: Key Signals, Thresholds, and Diagnosis
Why Traditional Checks Fall Short
A standard uptime check sends a request and evaluates the response code and maybe response body length. For a server rendered site, that's often a reasonable proxy for "is this working." For an SPA, it tells you almost nothing about whether the actual application the thing built with React, Vue, Angular, or similar is usable.
Meaningful SPA monitoring requires browser checks: automated checks that load the page in a real or headless browser, let the JavaScript execute, and then validate the result not just the initial server response.
Key Signals to Track
- JavaScript execution success did the bundle load and run without throwing fatal errors?
- Console errors are there unhandled exceptions or promise rejections during load?
- Rendered content presence did specific expected elements (not just any HTML) actually appear in the DOM?
- API/data fetch success did the client side calls the app depends on complete successfully?
- Time to interactive how long until a user can actually use the interface, not just see something on screen?
- Client side routing behavior do in app navigation and route changes render the expected view?
Framework-Specific Considerations
React app monitoring and monitoring for other component based frameworks share a common pattern: the check needs to wait for the framework's render cycle to complete before evaluating success, rather than checking immediately after the initial request. A check that evaluates too early will report a false failure simply because the app hadn't finished mounting yet.
Setting Thresholds for SPA Specific Metrics
| Signal | Healthy Range | Alert Threshold |
|---|---|---|
| JS bundle load + execute | 0.5–2s | > 4s |
| Time to first meaningful render | 1–3s | > 5s |
| Time to interactive | 2–4s | > 7s |
| API call completion (critical data) | 0.3–1.5s | > 3s |
| Console errors on load | 0 | > 0 (any fatal error) |
Diagnosis: Isolating Where an SPA Failure Happened
When an SPA check fails, the layered nature of the architecture means the failure could originate in several places:
- Build/deploy issue a broken production build that fails to load or execute at all.
- API/data layer issue the app loads and renders its shell, but a failed data fetch leaves key content missing or stuck in a loading state.
- Client-side routing issue navigation within the app breaks, even though the initial load succeeded.
- Third-party script conflict an external script interferes with the framework's execution or rendering.
Capturing console errors, network request results, and a screenshot at the point of failure turns a vague "the app didn't load" report into a specific, actionable diagnosis.
A Practical Production Scenario
Consider an illustrative example.
A SaaS team's traditional uptime monitor has been green for weeks. Their React based dashboard, however, starts throwing a client side error immediately after a routine dependency update a state management library update that's incompatible with a component further down the tree.
The server still returns the initial HTML shell correctly, so the uptime check keeps passing. But the moment the JavaScript bundle executes, it throws an unhandled exception, and the dashboard never renders past a loading spinner.
Because the team also runs a browser based SPA monitor that waits for the app to render and checks for a specific expected element, that monitor fails within the first check cycle after the deploy flagging the exact console error and a screenshot of the stuck loading state. The traditional uptime check never would have caught it, since from the server's perspective, nothing was ever wrong.
Recommended Monitor Setup
- Use browser based checks that execute JavaScript, not simple HTTP status checks, for any SPA or JS heavy site.
- Wait for the framework's render cycle to complete before validating success or failure.
- Capture console errors and unhandled promise rejections on every check, not just failures.
- Validate specific rendered content (a real element, not just any HTML) as the success condition.
- Include critical client side API calls in the check, since SPA functionality depends heavily on them.
- Test key client side routes, not just the initial load, since navigation failures are common in SPAs.
- Re run checks immediately after any frontend deploy or dependency update.
Best Practices for Monitoring JavaScript Heavy Applications
Monitor the Rendered App, Not the Initial Response
A raw HTTP check on an SPA's entry point tells you almost nothing. Validate the actual rendered output after JavaScript execution completes, since that's what real users experience.
Include Client Side Routing in Your Checks
Since navigation in an SPA doesn't trigger new server requests, a check that only covers the initial load will miss broken routes elsewhere in the application. Test navigation to key views, not just the landing page.
Track Console Errors as a First Class Signal
Unhandled JavaScript errors are often the earliest and clearest sign something is broken client side. Capture them on every check, and treat any fatal error as an immediate signal worth investigating.
Validate Data Dependencies, Not Just Rendering
An SPA can render its shell perfectly while critical data fails to load. Check that key API calls the interface depends on actually complete successfully, not just that some content appeared on screen.
Re-Test Immediately After Deploys and Dependency Updates
Frontend regressions are frequently introduced by dependency updates or new deploys, exactly the moments when traditional infrastructure monitoring shows nothing unusual. Build a check into your deployment pipeline, not just your ongoing schedule.
Assign Clear Ownership for Frontend Failures
Frontend/client side issues often belong to a different team than backend infrastructure. Make sure SPA monitoring alerts route to whoever actually owns the frontend codebase, not a generic infrastructure on call rotation.
Common Mistakes in SPA and Frontend Monitoring
Mistake 1: Relying Only on HTTP Status Checks
Why it happens: status checks are simple, already exist for other purposes, and require no browser environment to run.
What to do instead: use browser based checks that execute JavaScript and validate the actual rendered application, since a 200 response tells you almost nothing about an SPA's health.
Mistake 2: Checking Too Early, Before the App Finishes Rendering
Why it happens: it's tempting to evaluate success immediately after the initial request completes.
What to do instead: wait for the framework's render cycle and any critical data fetches to complete before evaluating whether the check passed or failed.
Mistake 3: Ignoring Client Side Routing
Why it happens: routing happens entirely in the browser, so it's easy to assume the initial load check covers it.
What to do instead: explicitly test navigation to key in app routes, since a broken route can leave users stuck without any server side signal of a problem.
Mistake 4: Not Capturing Console Errors
Why it happens: console errors require a real browser environment to observe, which basic monitoring tools don't provide.
What to do instead: use checks that capture console output and unhandled exceptions as a standard part of every run, not just as a debugging afterthought.
Mistake 5: Overlooking API and Data Dependencies
Why it happens: it's easy to focus on whether the page "looks right" without confirming the data behind it loaded correctly.
What to do instead: explicitly validate that critical client side API calls succeed, since a visually complete shell can still be missing its actual content.
Mistake 6: Not Rechecking After Deploys
Why it happens: monitoring is often treated as a background process disconnected from the deployment pipeline.
What to do instead: trigger a check immediately after any frontend deploy or dependency update, since this is when regressions are most likely to appear.
Start Monitoring Your Frontend the Right Way
A green uptime dashboard doesn't mean your JavaScript application actually works. Modern frontends need monitoring built for how they actually run in the browser, after the JavaScript executes, not just at the server's front door.
Start a 7 day Statixoup trial and configure browser based monitors for your single page application's critical views, routes, and data dependencies. The next time a deploy breaks something client side, you'll know before your users do.