Hosting Provider Monitoring: Scale Thousands of Sites
Learn how hosting providers can monitor thousands of customer websites using scalable policies, layered checks, and failure validation. Discover practical ways to reduce false alerts, group related incidents, and improve response across shared infrastructure.
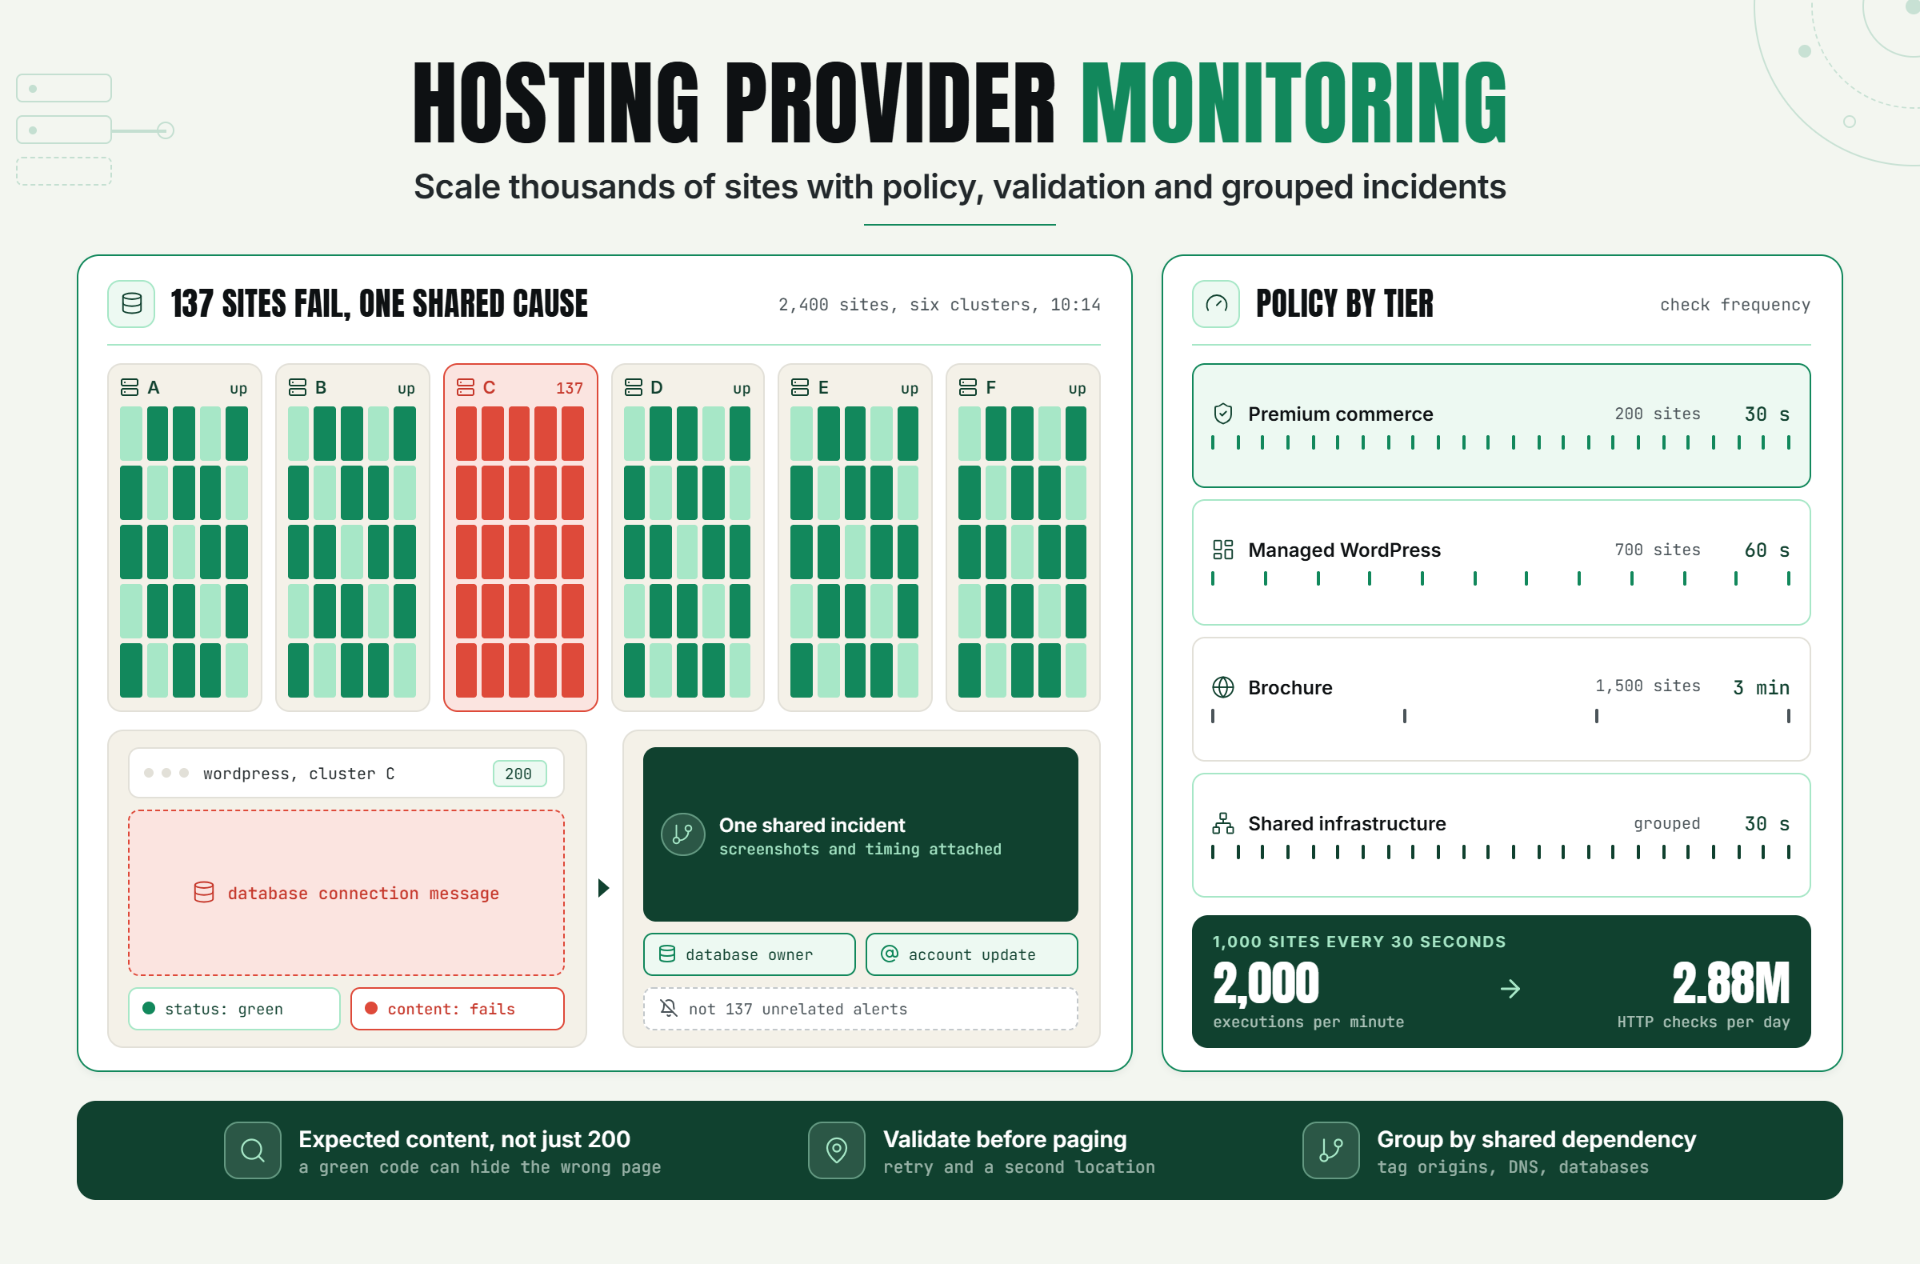
Hosting provider monitoring is the structured process of checking customer-visible sites and the services behind them at portfolio scale. A useful setup groups sites by platform and service tier, tests real outcomes instead of simple reachability, confirms failures from more than one vantage point, and routes only actionable incidents to the right owner. The result is earlier detection without turning the on-call channel into background noise.
My view is blunt: monitoring every domain with the same interval and the same alert rule is easy to configure, but it’s poor operations. A checkout site, a brochure site, a nameserver, and an SMTP endpoint don’t carry the same risk. Your policy has to reflect that.
The Portfolio-Scale Monitoring Problem
At ten sites, a spreadsheet and a few pings can look acceptable. At 1,000 sites, that approach breaks. Hosting provider monitoring has to absorb domain expiry, certificate rotation, DNS drift, and shared dependencies. A load balancer may return HTTP 200 while the application body contains a database error. One shared failure can otherwise produce hundreds of alerts that all describe the same incident.
And then ownership gets fuzzy. The web team sees the site failure, the network team owns the route, and support needs a customer-safe update. A useful incident severity model helps separate a noisy single-site event from a shared-platform outage before escalation begins.
The real cost isn’t the raw number of checks. It’s operational entropy: duplicate monitors, inconsistent thresholds, stale contacts, missing dependencies, and reports that can’t explain what the client experienced. Bulk monitor management must reduce that entropy, not merely create monitors faster.
How Hosting Provider Monitoring Works at Scale
A scalable hosting provider monitoring system has four layers: inventory, check policy, validation, and response. Inventory says what exists and who owns it. Policy says what success means. Validation separates a local probe problem from a customer-visible failure. Response decides who receives an alert, what evidence travels with it, and what customers are told.
Build a monitor inventory that matches the business
Start hosting provider monitoring with stable attributes: client ID, plan, platform, region, origin cluster, DNS provider, certificate owner, and escalation group. Tags beat folders when one site belongs to several operational views. A WordPress site on Cluster A might also be “premium,” “EU,” and “agency-managed.” You’ll need all four filters during an incident.
For bulk monitor management, use reusable policy templates. A premium commerce template might run an HTTP check every 30 seconds, validate expected text, track TLS expiry, and test DNS. A low-risk brochure template may run less frequently. The template is the policy; the domain is just an instance.
Use layered checks, not one green dot
In hosting provider monitoring, black-box checks answer whether the user-visible service works. White-box telemetry explains why it doesn’t. Google’s Site Reliability Engineering guidance defines the four golden signals as latency, traffic, errors, and saturation. It also warns that a successful HTTP code can still hide wrong content. That distinction matters for web hosting uptime monitoring because a default server page can return 200 while the customer application is effectively gone.
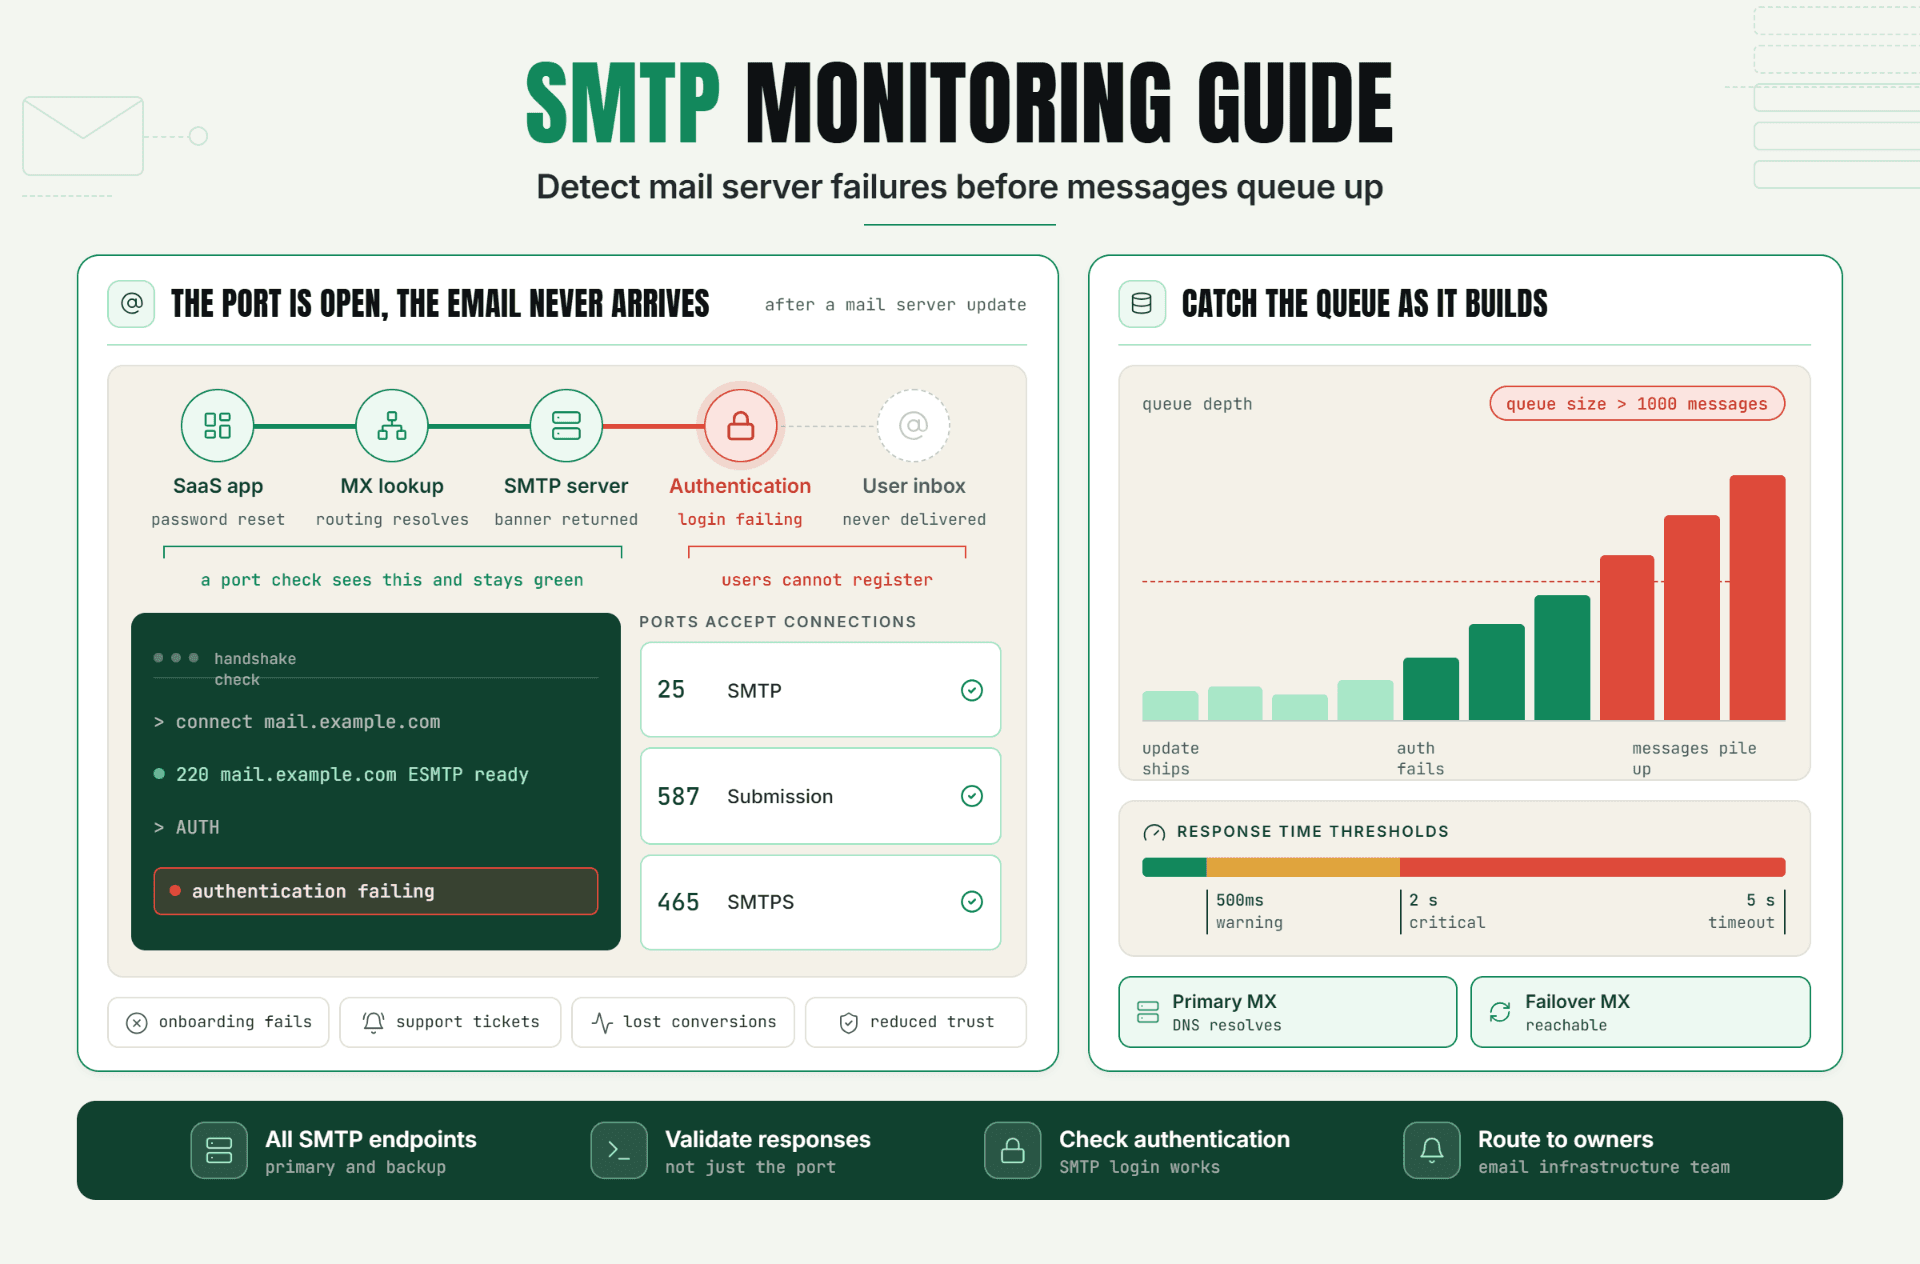
A practical stack combines HTTP content checks, SSL certificate validation, DNS resolution, TCP or UDP service checks, and browser transactions where JavaScript or authentication matters. For protocol selection, use the TCP versus UDP monitoring guide instead of treating every open port as equivalent.
What each layer should prove
- HTTP: the expected host, status, body marker, redirect path, and latency are correct.
- DNS: authoritative resolution returns the intended record from relevant regions.
- SSL/TLS: the certificate is valid, trusted, hostname-matched, and not close to expiry.
- Port and service: the endpoint speaks the expected protocol, not merely that a socket opened.
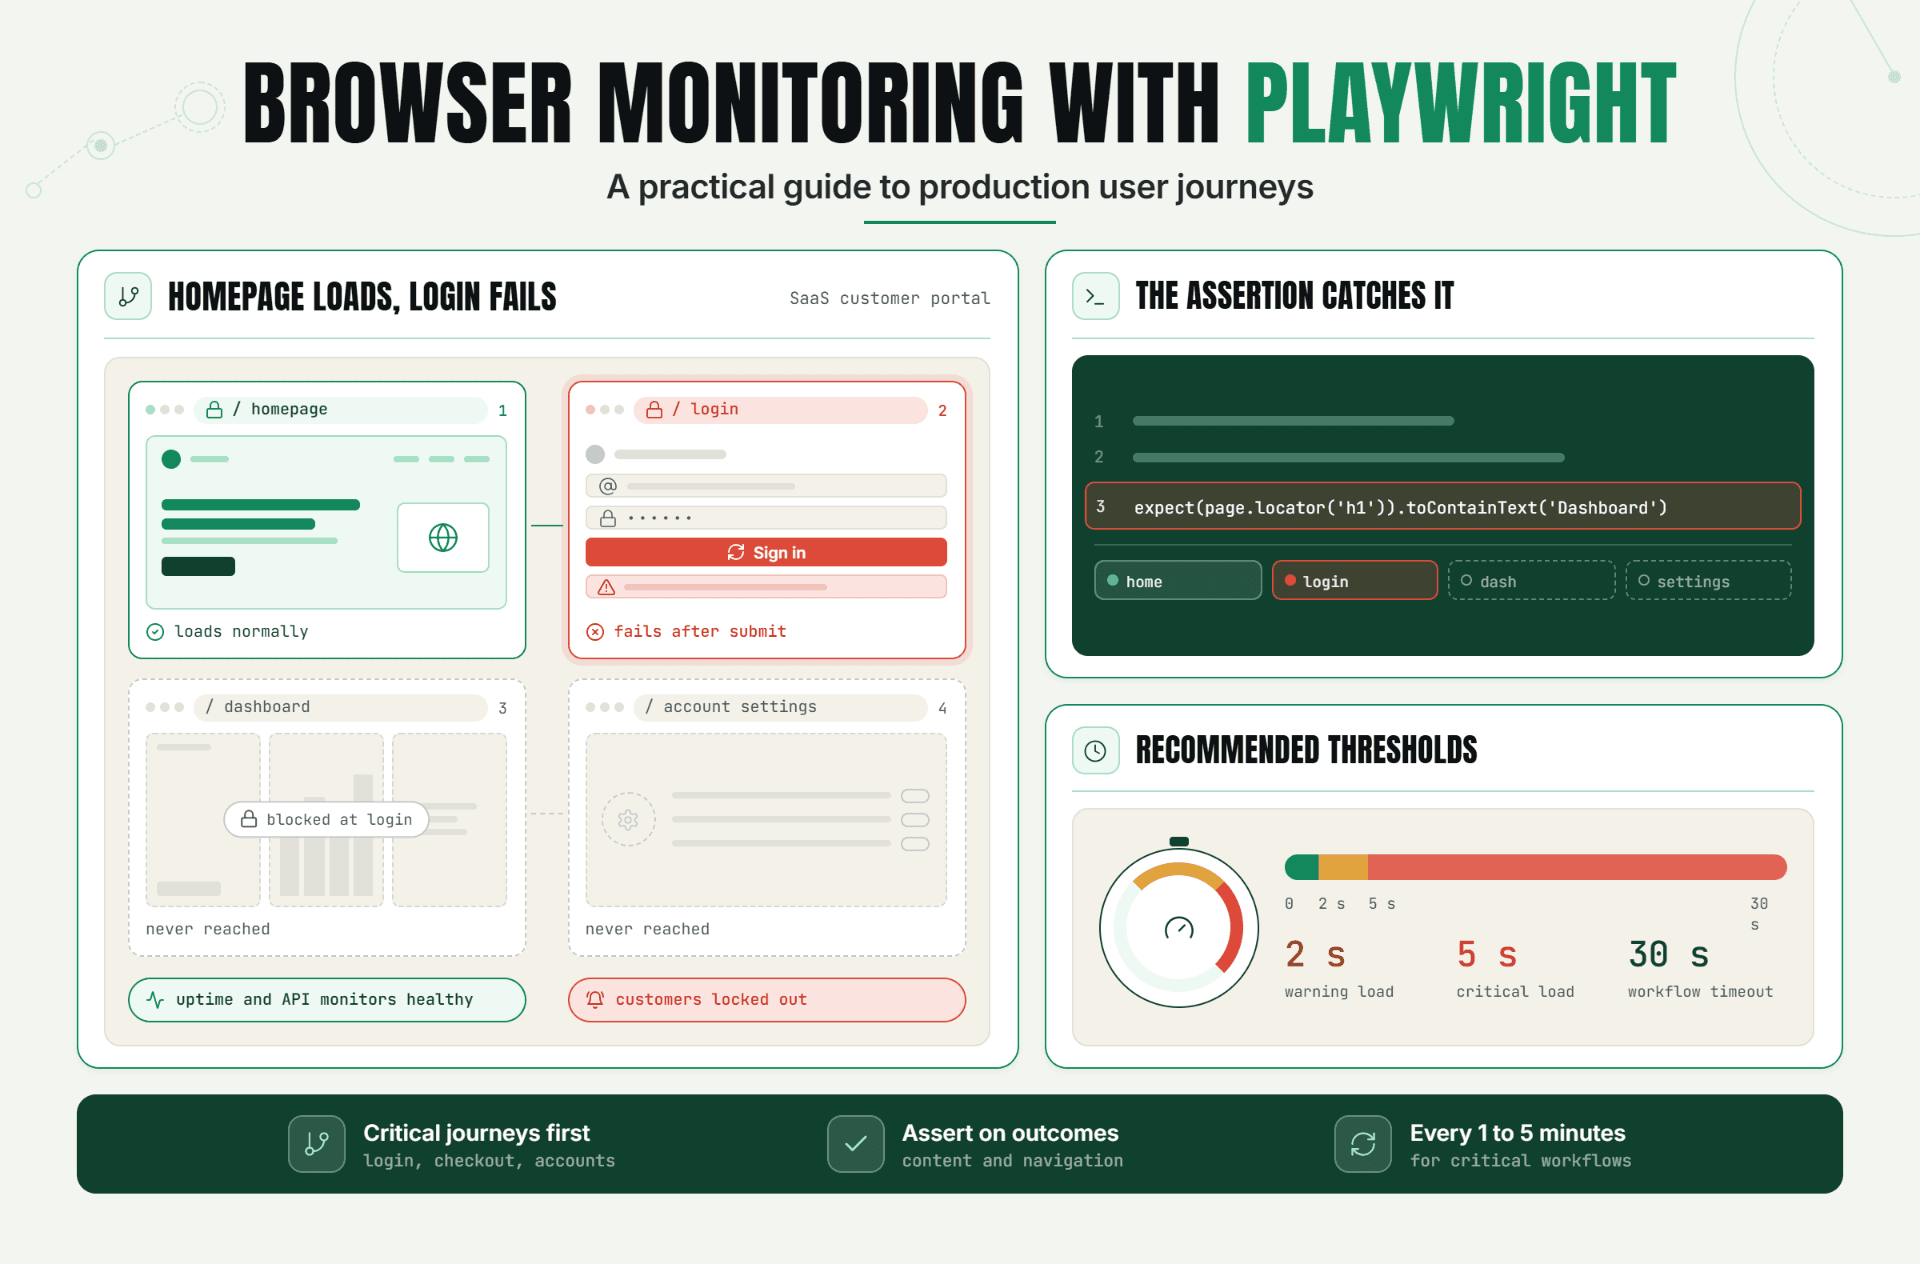
- Browser: a critical journey such as login, search, or checkout completes with real rendering.
When a real browser is necessary, Statixoup’s Playwright browser monitoring article explains why DOM assertions and transaction steps catch failures that a basic HTTP probe misses.
Set thresholds from risk and math
Check frequency controls detection speed, but it also controls volume. In hosting provider monitoring, one thousand sites checked every 30 seconds create 2,000 executions per minute before SSL, DNS, ports, and browser steps are added. That’s 2.88 million HTTP executions per day. The math is simple, and it’s why tiering matters.
Google SRE notes that a service targeting 99.9% annual availability may not need an HTTP success probe more than once or twice per minute. That isn’t a universal rule. It’s a reminder to connect sampling frequency to the service objective. High-value, fast-changing services justify faster checks. Slow-changing certificate expiry doesn’t need a 30-second loop.
Validate before paging a person
A single failed probe should usually create suspicion, not panic. Good hosting provider monitoring confirms from another location, retries after a short delay, and correlates sites that share an origin, nameserver, or network path. Statixoup says it validates failures before creating incidents or triggering notifications, which is exactly the right direction for portfolio monitoring.
Google SRE reports that a 10 to 12-person SRE team has historically assigned one or sometimes two people primarily to monitoring. Hosting providers can’t afford to multiply that effort by every customer. Standard policies, ownership metadata, and automated correlation are what keep the system maintainable.
When validation still points to a real incident, preserve the timeline. The website outage root cause analysis guide shows how alerts, logs, dependency data, and monitoring evidence become a defensible explanation instead of a guess.
Route incidents by blast radius and ownership
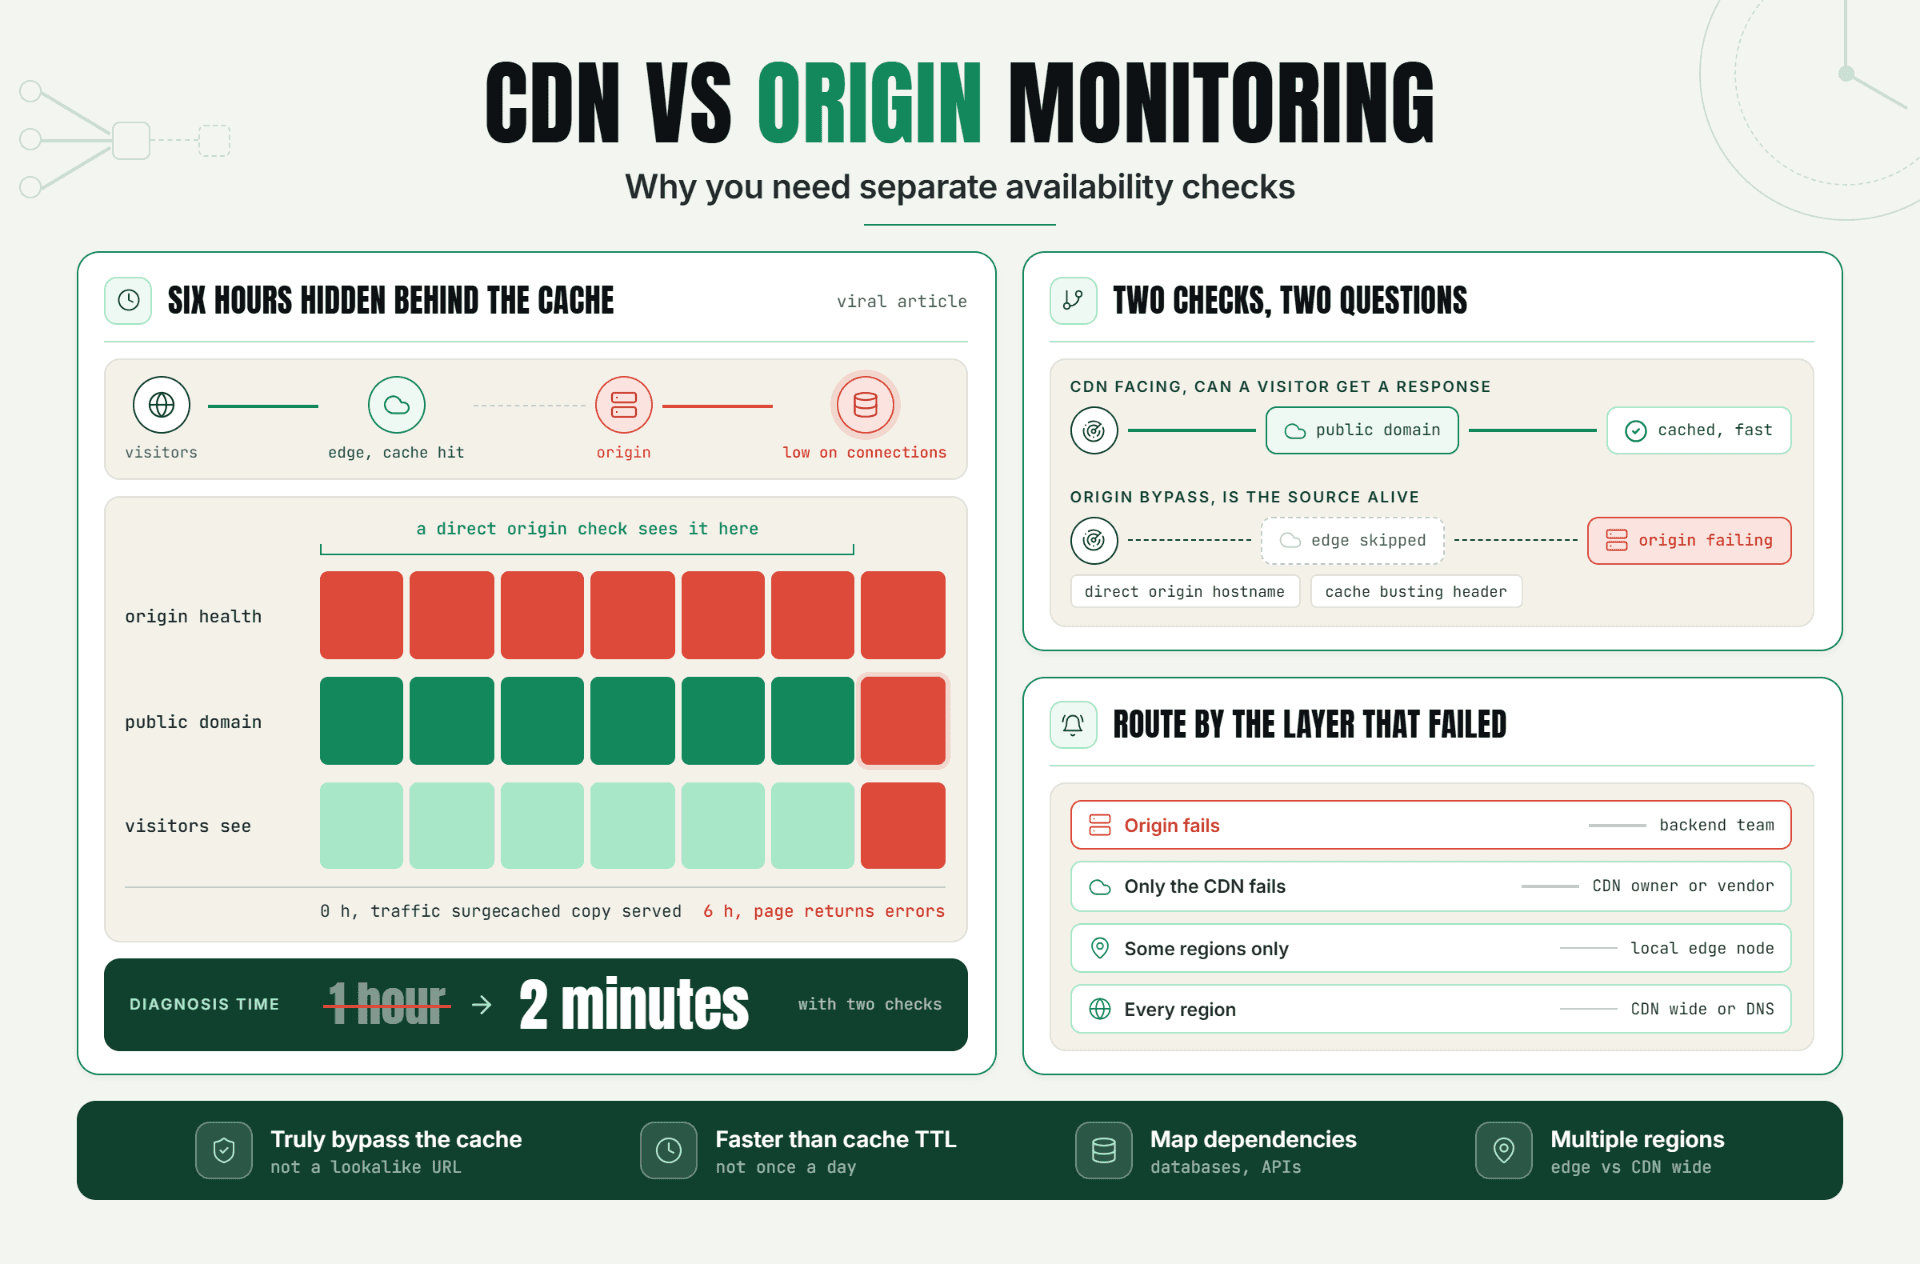
Hosting provider monitoring should route by three questions: How many customers are affected? Which shared component is common? Who can act now? A single premium client outage might page the account’s responder. Fifty failures on one origin cluster should page infrastructure once and notify support with a grouped incident. Don’t page 50 people with 50 copies of the same symptom.
Client status reports need the same discipline as hosting provider monitoring. Report availability, confirmed incidents, response time, certificate risk, and maintenance exclusions. Keep internal diagnostics such as private IPs, stack traces, and provider notes out of customer-facing views. Evidence should build trust, not leak architecture.
A Five-Step Setup for Reseller Website Monitoring
- 1. Import and tag the portfolio. Attach client, tier, platform, cluster, region, and owner metadata.
- 2. Assign a policy template. Choose HTTP content, DNS, SSL, port, API, or browser checks based on the service sold.
- 3. Set validation rules. Require retries or a second location before opening an incident, except for security-sensitive failures.
- 4. Map routing and communication. Connect the shared dependency owner, account responder, support queue, and status-page audience.
- 5. Test the system. Simulate a bad certificate, blocked origin, DNS error, and wrong-content HTTP 200. The result is a monitoring policy you know can detect, explain, and route failures.
Illustrative Production Scenario: 2,400 Hosted Sites
This hosting provider monitoring example is illustrative, not a published Statixoup customer case. Imagine an MSP managing 2,400 sites across six shared clusters. Two hundred are premium commerce sites, 700 are managed WordPress properties, and 1,500 are lower-risk brochure sites.
| Tier | Check frequency | Coverage | Escalation |
|---|---|---|---|
| Premium commerce | 30 seconds | HTTP content, API, SSL, DNS, browser checkout | Page on-call after validated failure |
| Managed WordPress | 60 seconds | HTTP content, SSL, DNS, login check on key accounts | Cluster owner, then account responder |
| Brochure | 3 minutes | HTTP content, SSL, DNS | Ticket unless shared cluster fails |
| Shared infrastructure | 30 seconds | Origin ports, DNS, mail, control panel, network path | Infrastructure page and grouped incident |
At 10:14, 137 WordPress sites begin returning a database connection message with HTTP 200. A status-only check stays green. Hosting provider monitoring with content validation fails correctly, and correlation shows every affected domain maps to Cluster C. The platform opens one shared incident, attaches screenshots and timing evidence, and routes it to the database owner. Account teams receive a controlled update rather than 137 unrelated alerts.
What didn’t work? The green status code. What changed in the hosting provider monitoring policy? Expected-content validation plus dependency tags. The useful result isn’t a made-up recovery percentage. It’s that the responder starts with the shared cluster and the actual error state instead of checking domains one by one.
Best Practices for Portfolio Monitoring
- Design coverage by service promise because the monitoring policy should reflect what the client bought.
- Use expected-content checks because HTTP 200 alone can confirm the wrong page.
- Separate fast checks from slow checks because uptime, TLS expiry, and capacity change at different speeds.
- Group by shared dependency because one root incident shouldn’t create hundreds of pages.
- Keep ownership in monitor metadata because a technically accurate alert is useless when nobody knows who acts.
- Test alert routes quarterly because stale contacts and revoked integrations often fail quietly.
- Give clients plain-language reports because raw probe logs don’t explain business impact.
Plan maintenance separately from incidents. The planned maintenance monitoring guide covers suppression, maintenance communication, and post-change validation without hiding genuine failures.
Common Mistakes That Break Hosting Provider Monitoring
Checking reachability instead of success
Why it happens: ping and status codes are cheap. What to do instead: validate expected content, protocol behavior, certificate trust, and at least one customer-critical journey for higher tiers.
Using one policy for every client
Why it happens: uniform templates feel efficient. What to do instead: keep templates, but create a small tiered set based on impact, not a unique policy for every site.
Paging on the first failure
Why it happens: teams equate speed with quality. What to do instead: make hosting provider monitoring retry, confirm from another region, and correlate shared dependencies before paging, unless the signal is immediately security-sensitive.
Ignoring dependencies
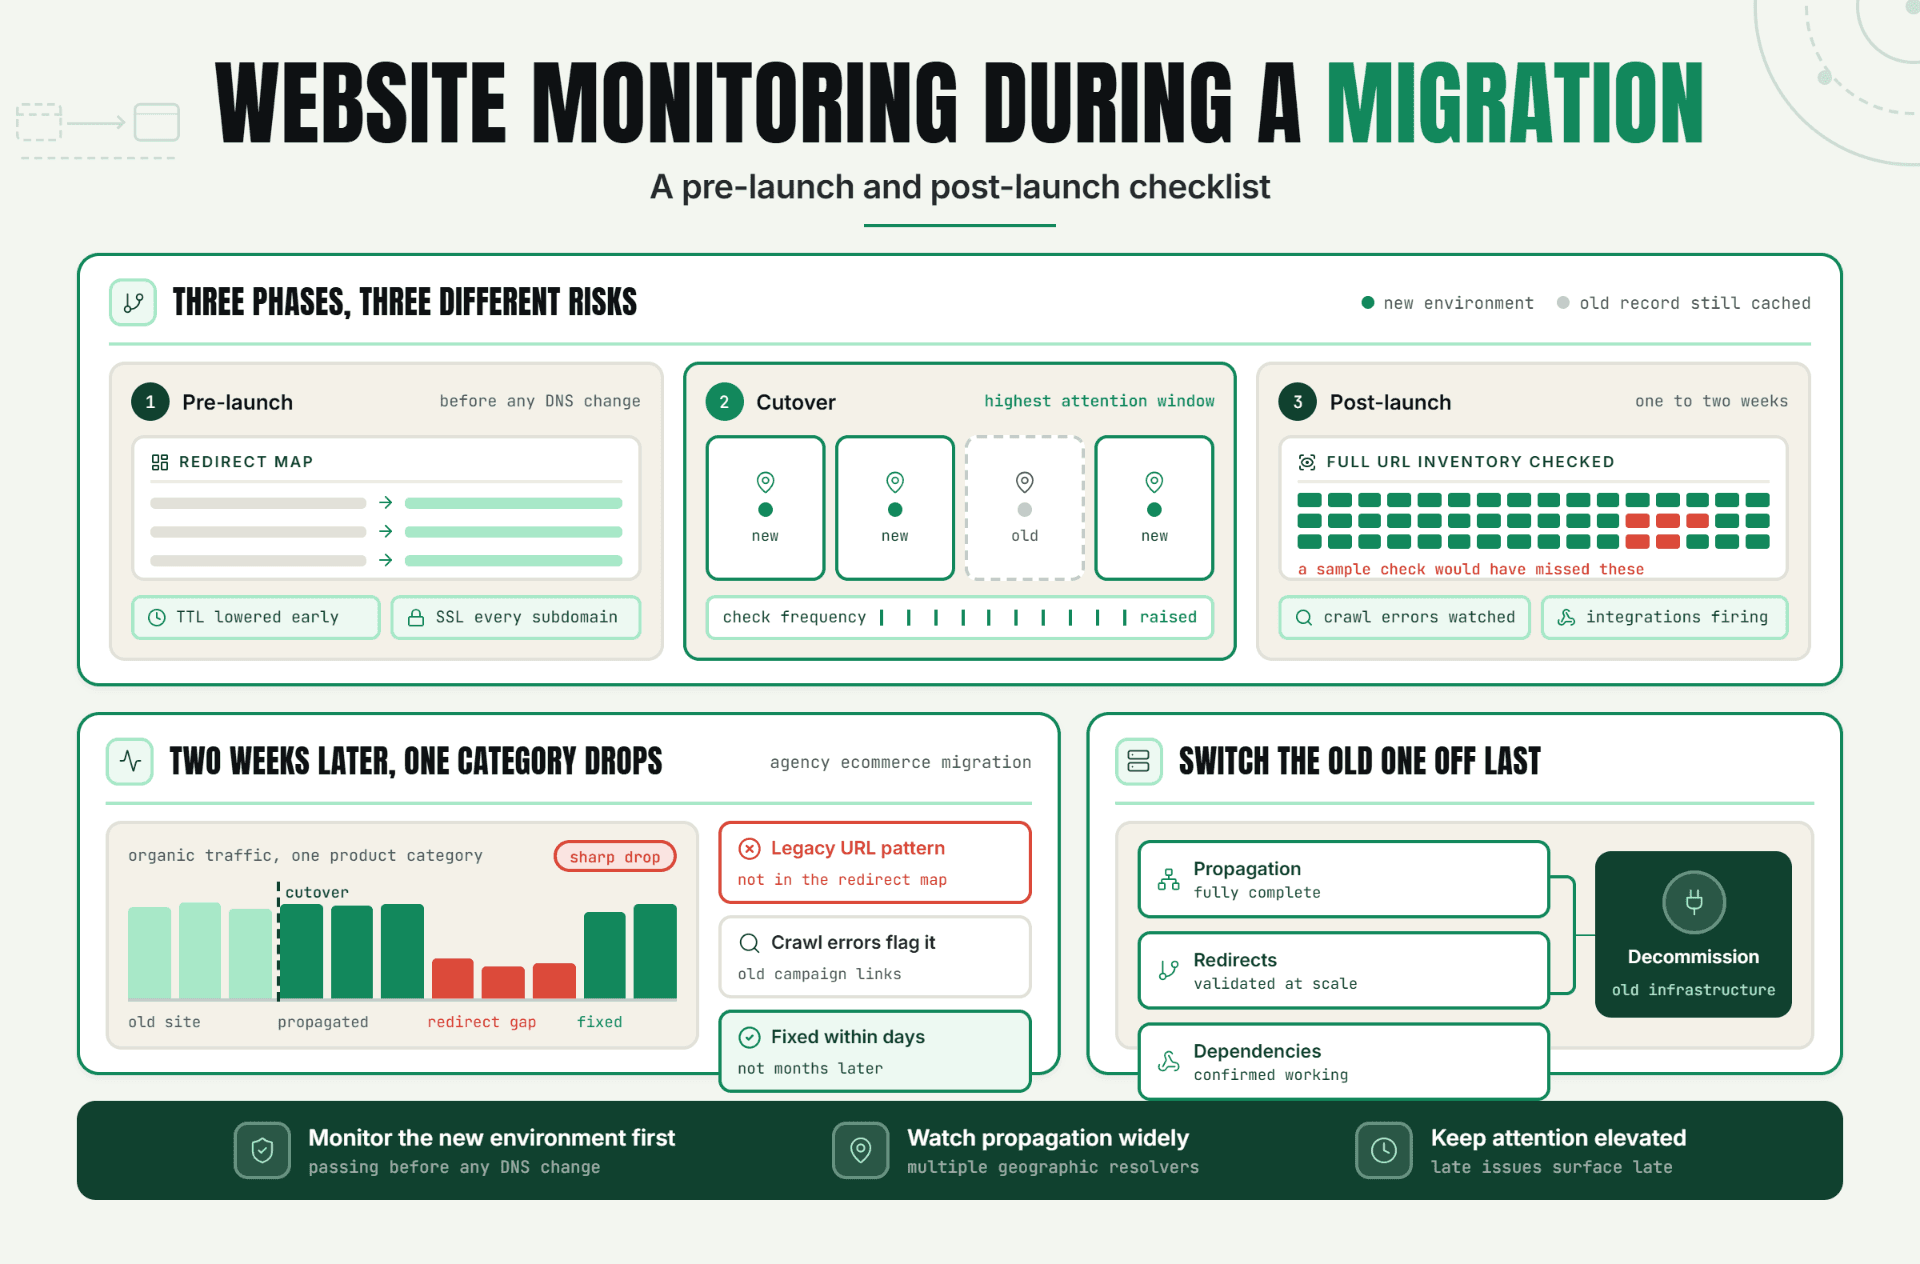
Why it happens: domain inventories are easier than architecture maps. What to do instead: tag origins, DNS providers, control panels, databases, mail relays, and upstream networks so bulk failures collapse into one incident.
Sending technical dumps to clients
Why it happens: internal evidence is already available. What to do instead: publish impact, affected services, start time, current action, and the next update. Keep private diagnostics private.
Conclusion
The winning model is policy at scale, not checks at scale. Hosting provider monitoring becomes useful when every check knows the service tier, expected outcome, shared dependency, owner, and customer communication path. A mature hosting provider monitoring program treats those fields as required. If they’re missing, adding more probes simply creates more noise.
Start with one cluster and one client tier. Build the template, break it on purpose, and watch what happens. You’ll learn more from that controlled failure than from a dashboard full of untested green dots.
Start a 30-Day Statixoup Beta
Start a 30-day Statixoup beta and configure a representative set first: one premium site, one shared origin, one SSL certificate, one DNS zone, and one server service check. Test a validated failure, confirm the alert reaches the right owner, and review the client-facing status update before you scale the policy across the portfolio.
Post a Comment

Hardik Vaghani
Hardik Vaghani is a Digital Marketing Professional and SEO Strategist based in Surat, Gujarat, India. He currently works with Ethnic Infotech, contributing to SEO, content marketing, technical SEO, and digital growth strategies. Hardik also creates blog content for Fusion5, focusing on technology, laptops, and consumer electronics. With expertise in SEO, Google Ads, Meta Ads, Local SEO, and Content Strategy, he helps businesses improve online visibility, rankings, and lead generation through data-driven marketing.
Frequently Asked Questions
Related Blogs