MTTD vs MTTR: Key Reliability Metrics to Track
MTTD and MTTR are two reliability metrics every online business should track to measure how fast issues are detected and resolved. Together they show how quickly a team can spot a problem and restore service before it impacts customers.
MTTD means mean time to detect: the average time between an incident starting and the team detecting it. MTTR usually means mean time to repair or recover: the average time required to restore service. Track both because fast detection can't compensate for a slow repair process, and a sharp response team can't fix an incident it doesn't know exists.
Here's my stance: a single “average incident duration” number is too blunt for an online business. Splitting MTTD from MTTR shows whether the bottleneck is monitoring, routing, diagnosis, ownership, or recovery. That makes the numbers useful, rather than decorative.
The operational problem: averages hide where response time goes
Teams often know the service was unavailable for 42 minutes. They don't know that 17 minutes passed before anyone noticed, another nine passed before the right owner joined, and only 16 were spent diagnosing and repairing the fault. One duration. Three different failures.
That gap affects more than an uptime report. Customers retry payments, support queues fill, internal teams lose confidence, and leaders make the wrong investment. Without an MTTD vs MTTR breakdown, a team may buy another observability tool when its real problem is alert routing. Or it may rewrite runbooks while a five-minute check interval keeps outage detection time high.
How MTTD vs MTTR works
MTTD vs MTTR measures two adjacent parts of the incident lifecycle. MTTD covers incident start to detection. MTTR covers recovery time under the definition your team adopts. The catch is that MTTR isn't universally defined. Atlassian notes that the same acronym may refer to repair, recovery, resolve, or response, so the start and end timestamps must be written down before comparing results.
Mean time to detect: the monitoring delay
Use this formula:
MTTD = total detection delay across incidents ÷ incident count
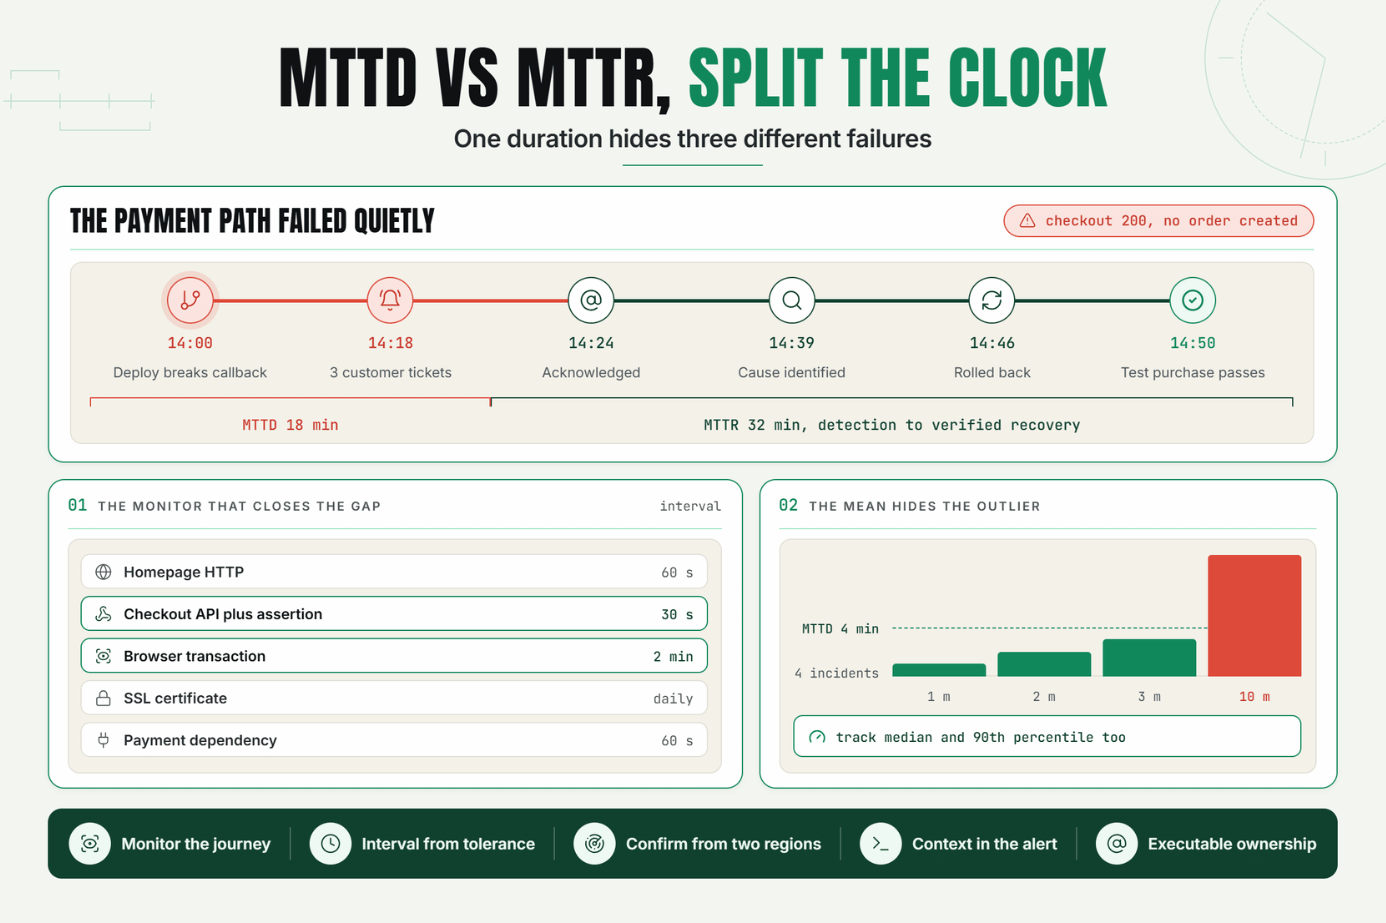
If four incidents took 1, 2, 3, and 10 minutes to detect, MTTD is four minutes. Simple. But the ten-minute incident deserves more attention than the average suggests.
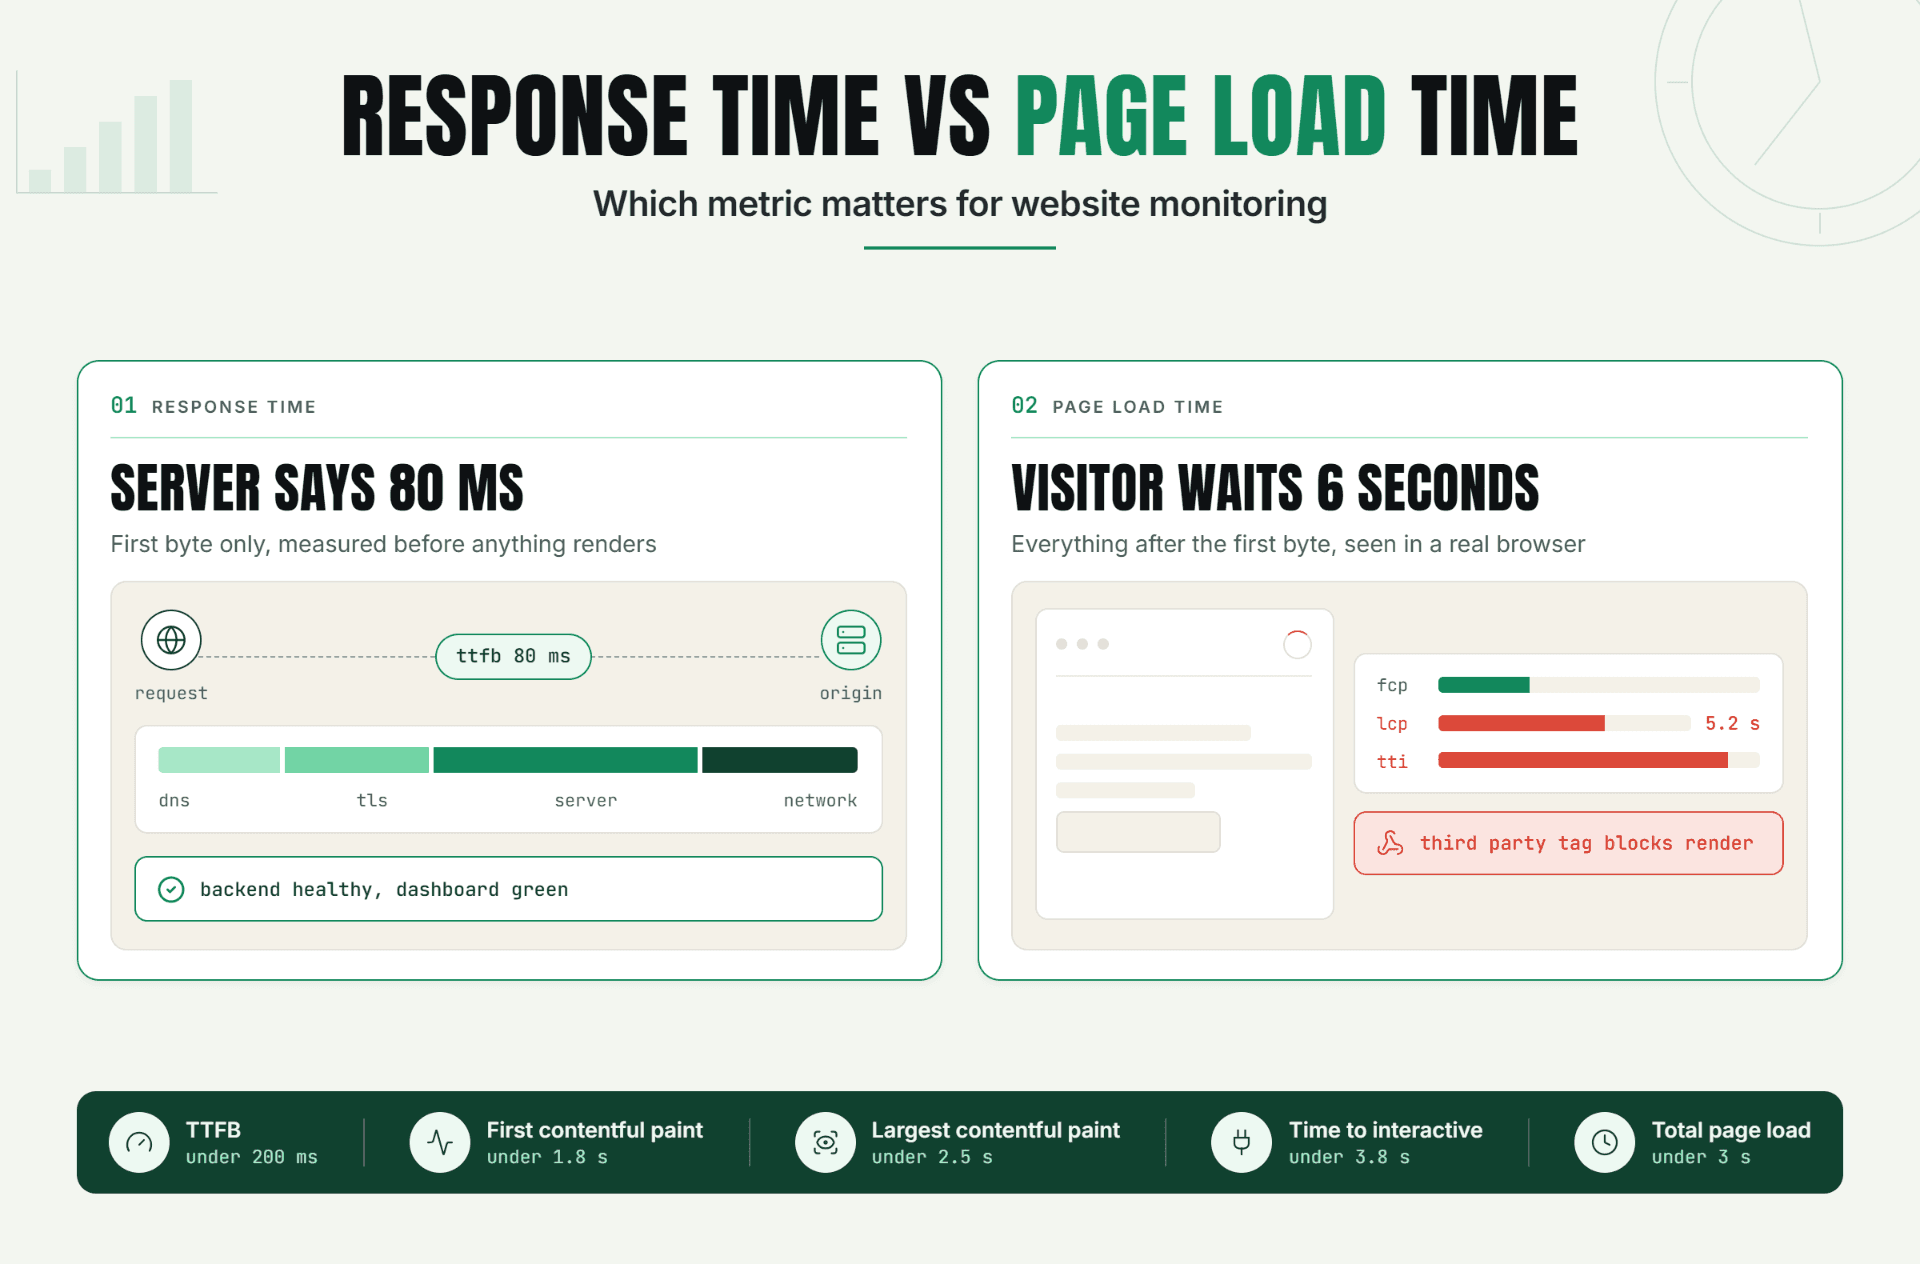
The floor is partly mechanical. A monitor that checks once every five minutes may encounter a failure immediately after a successful check. It can't observe that failure until the next check. Delivery latency, failure validation, and regional confirmation add more time. In MTTD vs MTTR reporting, those seconds belong on the detection side.
That's why monitor frequency should follow the user journey. A 30-second check can make sense for login, checkout, or a public API. A slower interval may be fine for a low-risk marketing page. Statixoup describes its 30-second global monitoring as a way to detect outages quickly while validating failures to limit false alerts.
Google's SRE guidance makes a useful distinction here. Black-box monitoring tests externally visible behaviour, while white-box monitoring reads internal telemetry such as logs and metrics. For paging, Google favours symptom-oriented signals that represent active user impact. In practice, teams need both: an external check proves the customer path is failing, and internal telemetry helps explain why. See Google SRE's monitoring guidance.
A better detection threshold
Don't alert on “anything unusual.” Alert on an urgent, actionable symptom. For an API, that might be two confirmed failures from separate locations, a sustained error-rate breach, or a latency threshold exceeded across several checks. This raises MTTD by a few seconds, but it can reduce alert noise and speed real response.
Mean time to repair: the recovery delay
Use a definition the whole team can repeat:
MTTR = total repair or recovery time across incidents ÷ incident count
For this guide, MTTR begins when an incident is detected and ends when the affected customer journey has been verified as healthy. That definition keeps MTTD vs MTTR from double-counting the detection window and prevents “the server is up” from ending the clock before checkout actually works.
MTTR contains several smaller intervals: acknowledgement, triage, diagnosis, change, and verification. If the number is high, split it again. A 50-minute MTTR caused by 35 minutes of diagnosis needs better evidence. The same 50 minutes caused by an unowned database alert needs better routing. MTTD vs MTTR gets you to the right half of the problem, while these smaller intervals reveal the exact delay.
The Atlassian guide to common incident metricswarns that means can be distorted by outliers. Track the median and 90th percentile beside the mean. Five quick fixes and one six-hour incident can produce an average that describes none of the actual events.
Statixoup's MTR vs traceroute guide is relevant when diagnosis points toward packet loss, latency, or routing. Repeated MTR probes preserve more evidence than a single route snapshot, which can shorten the diagnosis portion of MTTR.
Turning incident metrics into one operating view
The useful equation is:
Customer-impact window = detection delay + acknowledgement + diagnosis + repair + verification
Don't use MTTD vs MTTR as a leaderboard. Use it as a routing question. If MTTD rises, inspect coverage, interval, thresholds, and delivery. If MTTR rises, inspect ownership, context, runbooks, access, rollback options, and recovery validation. This is where MTTD vs MTTR becomes an operating tool instead of another reporting slide.
A practical review process is: 1. record incident-start, detection, acknowledgement, mitigation, and verified-recovery timestamps; 2. calculate MTTD and MTTR using the same definitions; 3. segment by service and severity; 4. inspect outliers; 5. assign one improvement with an owner and due date. The result is a reliability KPI tied to work the team can actually complete.
A realistic production incident: the payment path fails quietly
This is an illustrative example, not a Statixoup customer claim.
Imagine a subscription business with a React storefront, a checkout API, a payment provider, and a PostgreSQL database. At 14:00, a deployment changes an environment variable used by the payment callback. The homepage stays green. Product pages load. Checkout returns HTTP 200, but the response body contains an application error and no order is created.
The team's basic uptime check only tests the homepage. The first signal arrives at 14:18 through three customer tickets. An engineer acknowledges the problem at 14:24, identifies the callback failure at 14:39, rolls back at 14:46, and verifies a test purchase at 14:50.
For this incident, MTTD is 18 minutes. MTTR is 32 minutes under our detection-to-verified-recovery definition. The full customer-impact window is 50 minutes. That MTTD vs MTTR split tells the team that detection consumed more than a third of the event.
What didn't work? The check proved the web server could answer, not that a customer could pay. Alerting wasn't the only weakness. The team also lacked an automatic screenshot, response-content assertion, and dependency-aware test.
The recommended setup changes the signal:
Monitor | Check | Frequency | Failure rule | Route |
|---|---|---|---|---|
Homepage HTTP | Status, TLS, latency | 60 seconds | Two confirmed failures | Operations channel |
Checkout API | Status plus response assertion | 30 seconds | Missing success field or error response | On-call engineer |
Browser transaction | Login, add item, test checkout | 2 minutes | Any failed step or wrong confirmation | On-call plus engineering lead |
SSL certificate | Validity, chain, expiry | Daily | 30-day and 7-day thresholds | Operations owner |
Payment dependency | Synthetic callback and provider status | 60 seconds | Confirmed dependency failure | Payments owner |
With a 30-second API check and a two-failure confirmation rule, detection would normally occur shortly after the second check, plus alert delivery time. Don't promise a fixed result without test data. Measure it during a controlled exercise, then put the observed MTTD vs MTTR result beside the original incident.
The browser transaction matters because an HTTP 200 isn't the same as a successful purchase. Statixoup lists Playwright-based browser monitoring for JavaScript-rendered transactions, while its SSL certificate monitoring guide covers a different failure class that can take an entire customer path offline.
And here's the point: better MTTD vs MTTR performance comes from better evidence, not simply more alerts. An incident screenshot, response timeline, region data, and MTR output can give the responder a starting hypothesis. A bare “site down” page gives them a mystery.
Best practices for detection and repair metrics
Measure the customer journey, not just the server
Cover login, search, checkout, form submission, and API responses because a healthy homepage can hide a broken business process. Start with the path whose failure creates the fastest customer escalation, then segment its MTTD vs MTTR data from lower-priority services.
Set check frequency from tolerance
If the team wants MTTD below two minutes, a five-minute interval can't meet the target. Choose the reliability KPI first, then configure the monitor. For revenue-critical paths, test 30-second checks. For lower-severity services, reduce frequency and notification priority.
Validate without making detection sluggish
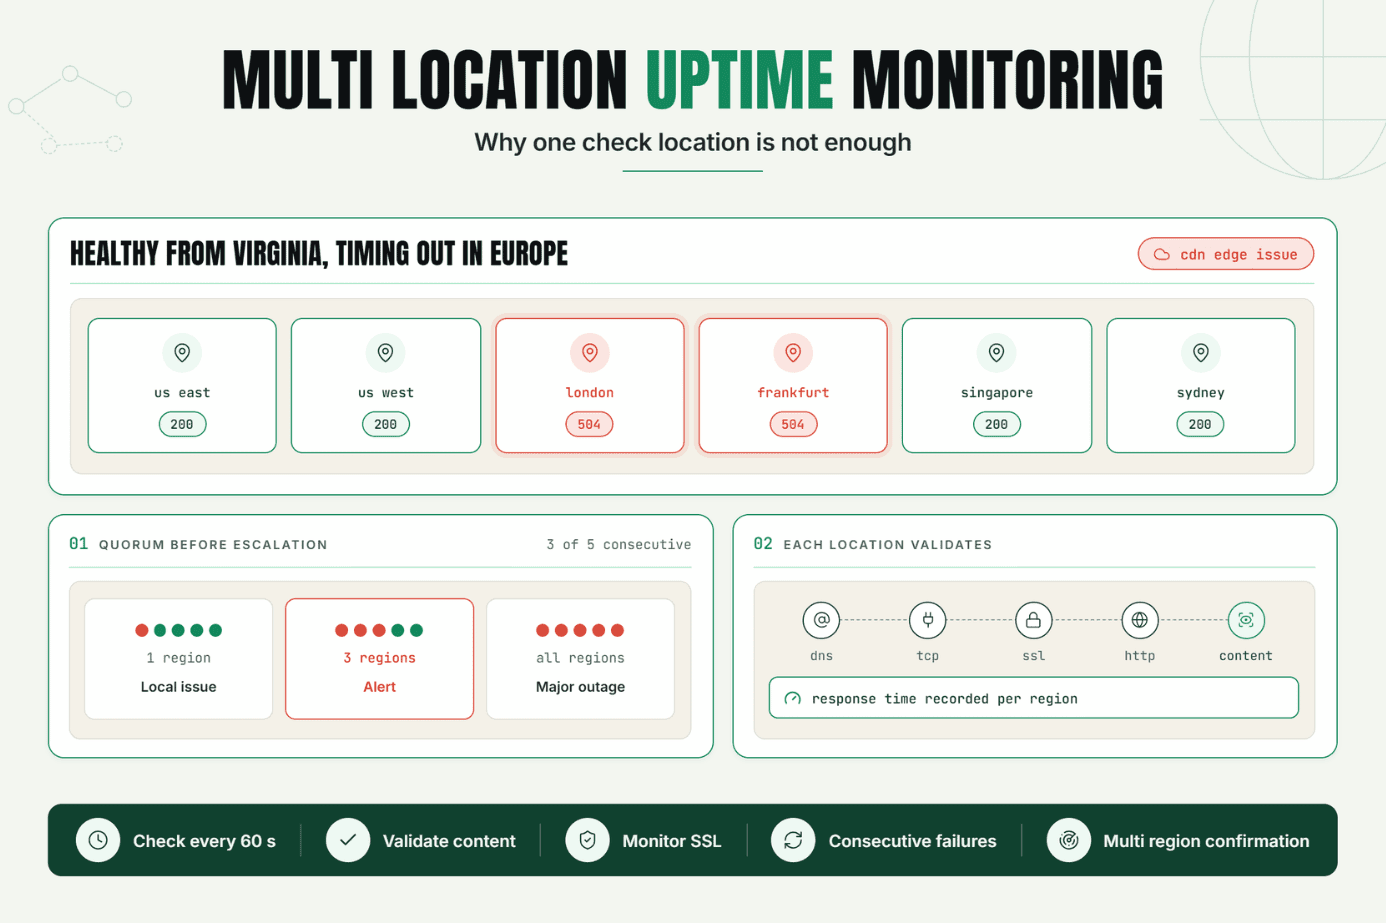
Confirmation protects responders from transient network noise. But three checks at five-minute intervals can add roughly ten minutes before an alert after the first failed observation. Use multiple locations, short confirmation spacing, and content assertions to protect signal quality without inflating MTTD.
Put context in the alert
Include the affected URL, failed assertion, first-failure time, region, screenshot, recent timeline, and owner. This doesn't change detection time. It reduces blank-screen diagnosis time, which is often the most avoidable part of MTTR.
Make ownership executable
Every page needs a named primary route, a fallback route, and an escalation delay. Statixoup publishes setup documentation for both Slack uptime alerts and Discord uptime alerts. Pick the channel people already watch, then test it outside a live incident.
Review distributions, not one average
Track mean, median, 90th percentile, and incident count by severity. A falling mean with a rising 90th percentile means common incidents are improving while the hardest failures remain stuck. That's a more honest MTTD vs MTTR story.
Common mistakes that distort detection and repair metrics
Weak checks
A ping or homepage status check can be green while checkout is broken. It happens because teams monitor what is easiest to request. Add response assertions and browser transactions for the flows customers depend on.
Noisy alerts
Sending every brief timeout to every engineer creates hesitation. Google SRE notes that frequent pages can cause people to skim or ignore a real alert hidden in the noise. Page on urgent customer symptoms, validate failures, and send lower-priority signals to a dashboard.
Missing dependencies
Teams monitor their application but ignore DNS, SSL, payment providers, email delivery, queues, and scheduled jobs. Map the customer path, then attach at least one signal to each dependency that can stop it.
Poor routing
An accurate alert in an unowned inbox is still slow detection in operational terms. Route by service, publish the escalation path, and run notification tests. Don't discover during an outage that the on-call channel was muted.
Changing definitions mid-quarter
One team starts MTTR at incident onset. Another starts at acknowledgement. Their charts look comparable but aren't. Write the timestamp definition beside the dashboard and keep it stable. When it changes, mark the date.
Conclusion
The value of MTTD vs MTTR isn't the pair of numbers. It's the argument they settle. One points toward monitoring coverage and delivery. The other points toward ownership, diagnosis, and recovery.
Start with one customer-critical journey. Record five timestamps, test the route, and review the first real incident without smoothing away the awkward parts. Reliability improves when the data leads to one owned change.
Call-to-action: configure the monitor that closes your detection gap
Start a free 7-day Statixoup tria and configure one monitor for the customer journey that matters most. Use a 30-second website or API check for a critical endpoint, add the expected response, route verified failures to the active on-call channel, and run a controlled test.
Then measure the result. Your first useful MTTD vs MTTR dashboard begins with one properly monitored path, one owner, and timestamps the team trusts. If you want to compare monitoring coverage before setup, review Statixoup's website monitoring solutions guide and current monitoring plan options.
Post a Comment

Hardik Vaghani
Hardik Vaghani is a Digital Marketing Professional and SEO Strategist based in Surat, Gujarat, India. He currently works with Ethnic Infotech, contributing to SEO, content marketing, technical SEO, and digital growth strategies. Hardik also creates blog content for Fusion5, focusing on technology, laptops, and consumer electronics. With expertise in SEO, Google Ads, Meta Ads, Local SEO, and Content Strategy, he helps businesses improve online visibility, rankings, and lead generation through data-driven marketing.
Frequently Asked Questions
Related Blogs