Port Monitoring Guide: Catch TCP Failures Before Users Do
Learn port monitoring the smart way: track TCP services in real time, catch silent failures early, and stop outages before customers notice. Start free today.
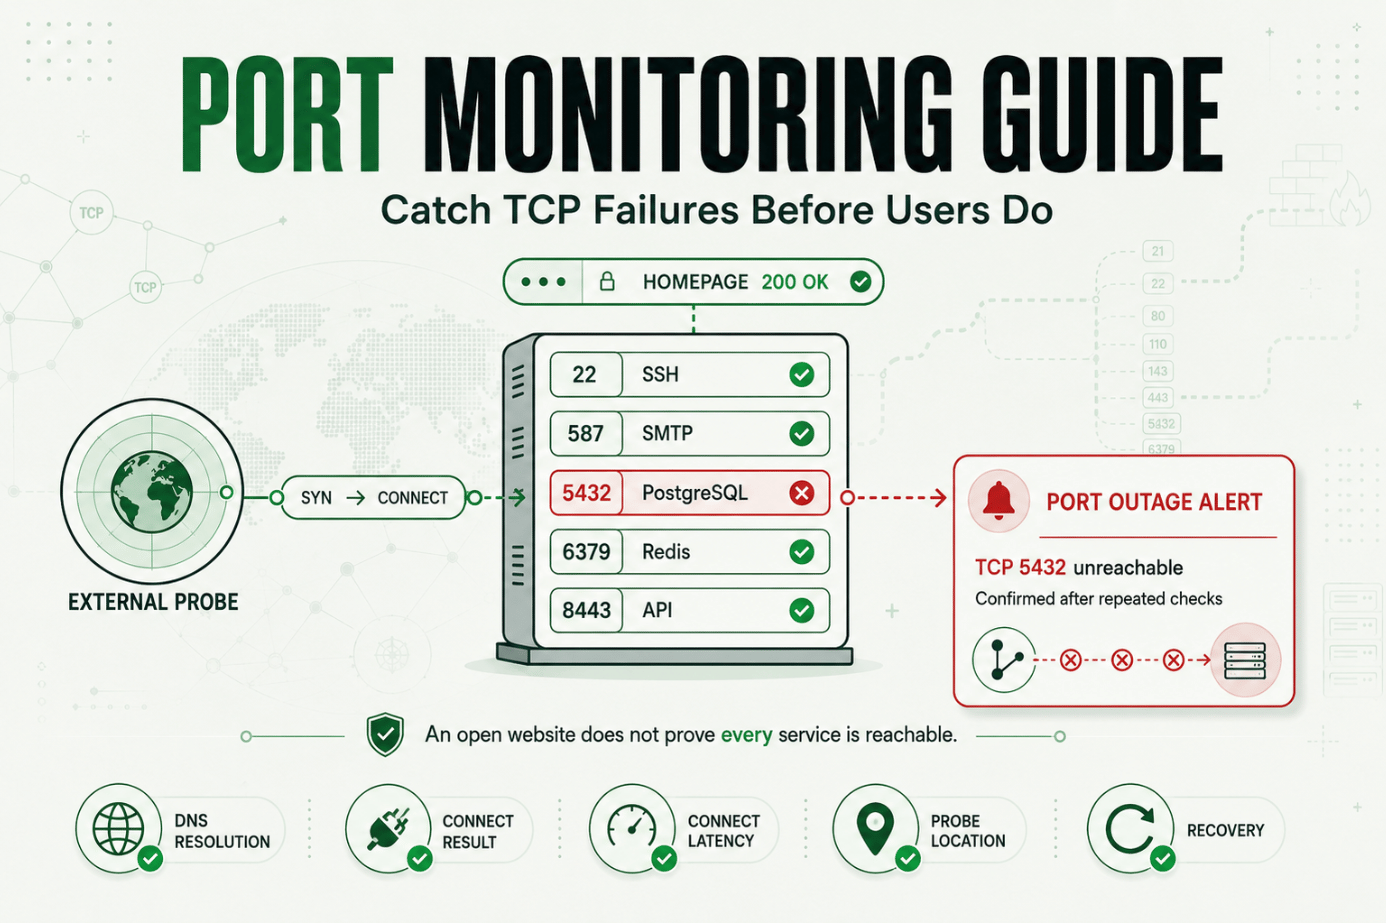
That gap is why port monitoring matters. Statixoup is a reliability monitoring platform for technical teams that checks customer-facing services as often as every 30 seconds and gathers incident evidence when something fails. A port monitor adds coverage below the web page by testing whether a named TCP service can accept a connection from outside your network.
The short answer: port monitoring repeatedly connects to a specific host and TCP port, records whether the connection succeeds and how long it takes, then alerts when a defined failure threshold is crossed. It can catch a dead database listener, blocked SMTP service, failed SSH daemon, or firewall change before the first support ticket arrives.
But a green port isn't the same as a healthy application. That distinction runs through this entire guide.
The problem: a listening port can fail quietly
Web checks cover what a browser can reach. They don't automatically prove that SMTP on 587, SSH on 22, PostgreSQL on 5432, Redis on 6379, or a custom gateway on 8443 is reachable from the network that matters.
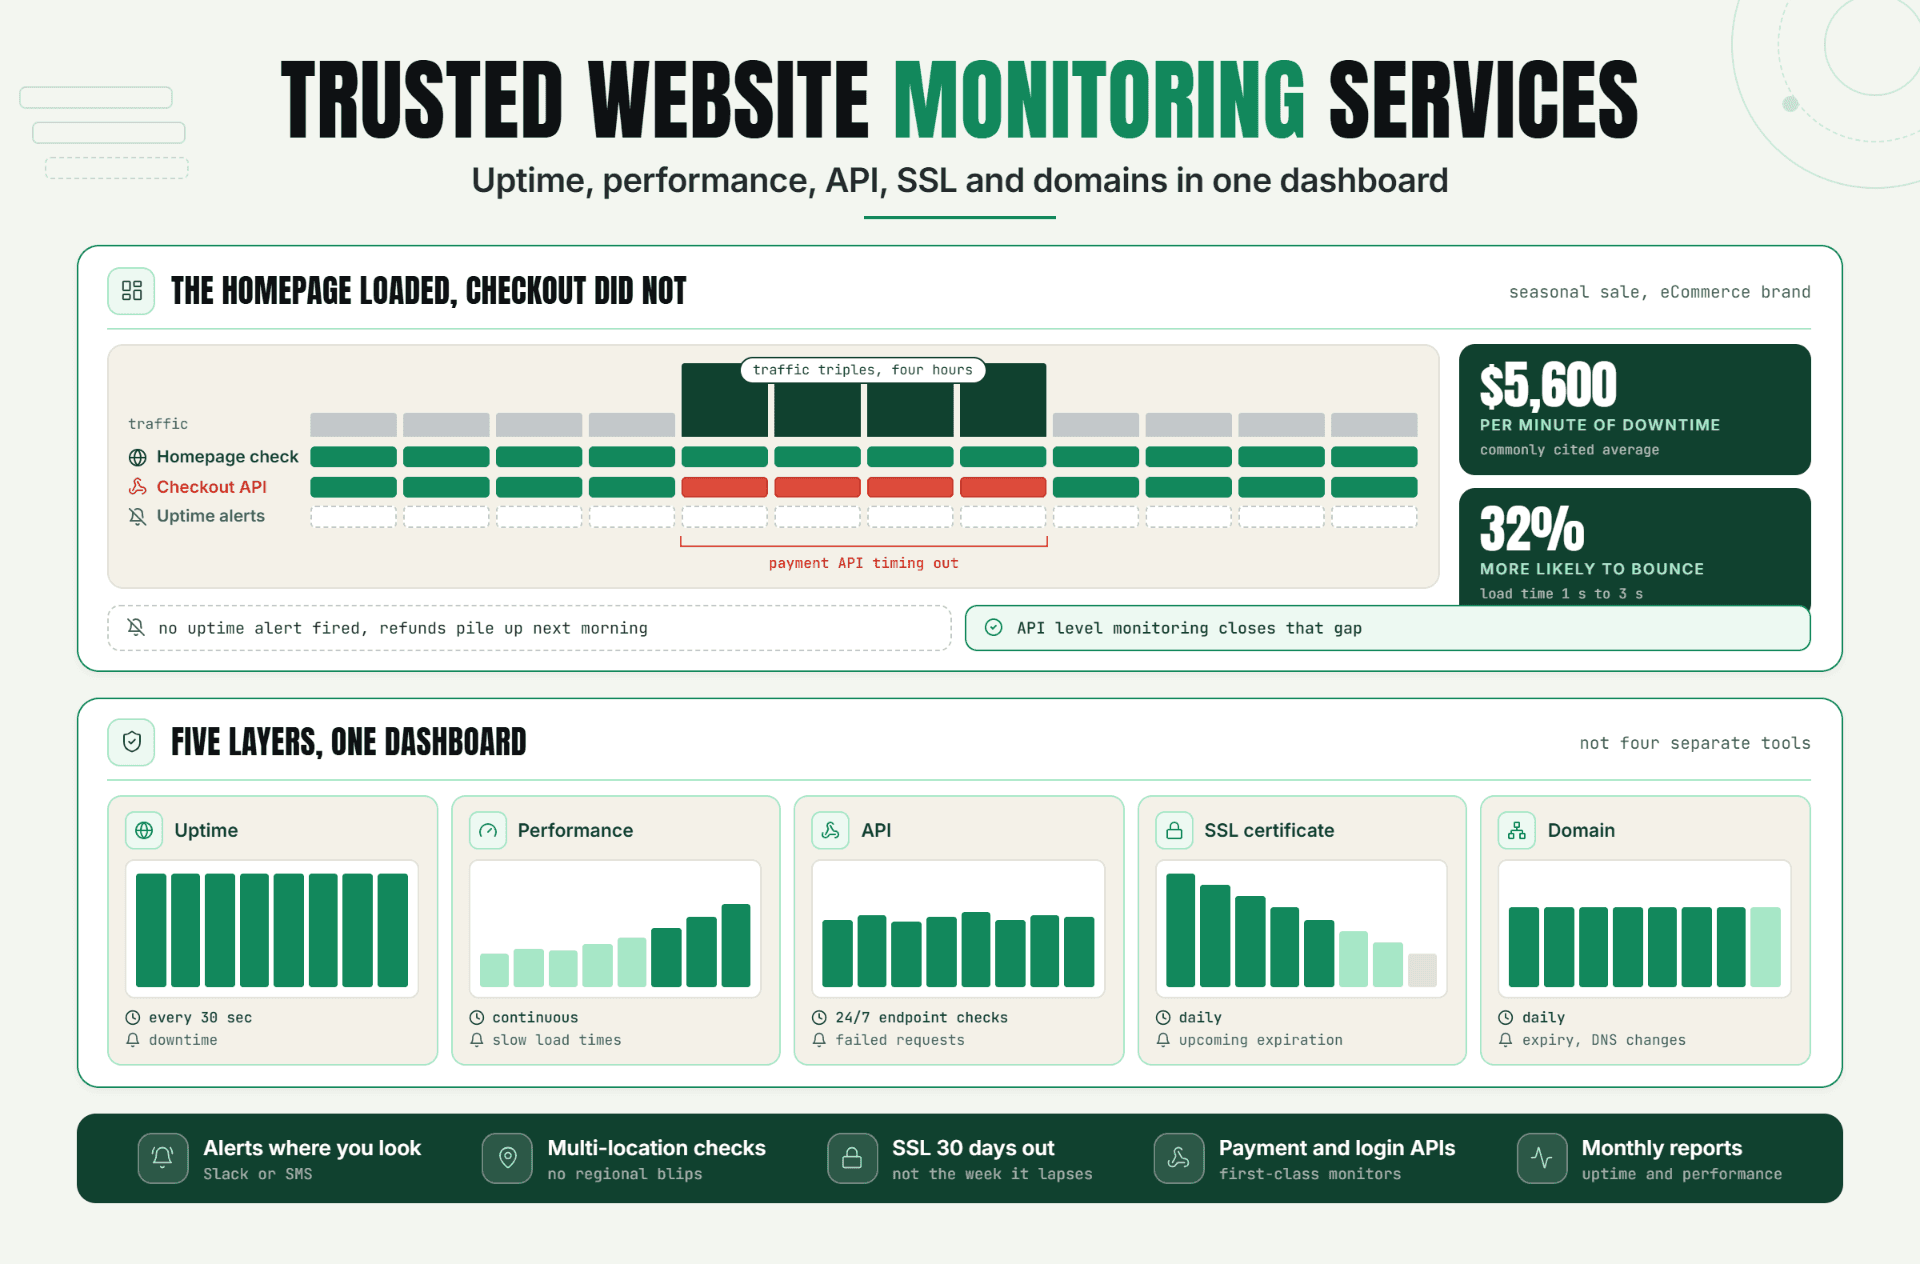
Without port monitoring, teams often learn about these failures sideways. A deployment job times out. Mail queues grow. A backup can't reach the database. Customers report that one feature hangs while the rest of the site looks normal. The service is already failing; diagnosis hasn't even started.
The cost can be real. Uptime Institute's 2024 outage analysis reports that 54% of respondents said their most recent significant, serious, or severe outage cost more than $100,000, while 16% put the cost above $1 million. It also identifies network-related issues as the largest single cause of IT service outages. Those figures describe large infrastructure incidents, not the expected cost of every failed port, but they show why early network service monitoring deserves a place beside HTTP checks.
For the business context, see Statixoup's guide to the real cost of website downtime. For the platform's wider coverage, read what Statixoup monitors.
How port monitoring works
Port monitoring is an external black-box check against a host and destination port. The monitoring location resolves the hostname, opens a TCP connection, measures the outcome, and closes it. A basic success means the remote endpoint completed the connection handshake within the timeout.
The underlying model is well defined. IETF RFC 9293 describes TCP as a connection-oriented, reliable byte-stream protocol and notes that port numbers identify application services. It also makes an easy-to-miss point: TCP doesn't inherently include liveness detection. A connection that worked ten minutes ago says nothing about the service now.
What a TCP port check actually proves
A successful check proves a narrow fact: from that monitoring location, at that moment, the target IP accepted a TCP connection on the requested port before the timeout.
That's useful. It tells you that DNS resolution, part of the network path, firewall policy, load-balancer forwarding, and a listening socket worked together well enough to complete the handshake.
It doesn't prove that authentication works, a database query completes, an SMTP server can relay mail, or the application behind the listener returns correct data. A proxy can accept connections while every upstream is dead. A process can listen while its worker pool is exhausted.
My blunt view: a connect-only monitor is a smoke alarm, not a building inspection. Keep it. Just don't ask it to prove more than it can.
The signals worth recording
Good service availability monitoring records more than up or down:
Signal | What it tells you | Useful alert condition |
|---|---|---|
DNS resolution | Whether the hostname resolves from the probe | Repeated resolution failure |
Connect result | Whether TCP establishment succeeds | Refused, timed out, or unreachable |
Connect latency | How long the handshake takes | Sustained rise from the baseline |
Failure count | Whether the issue persists | Two or three consecutive failures |
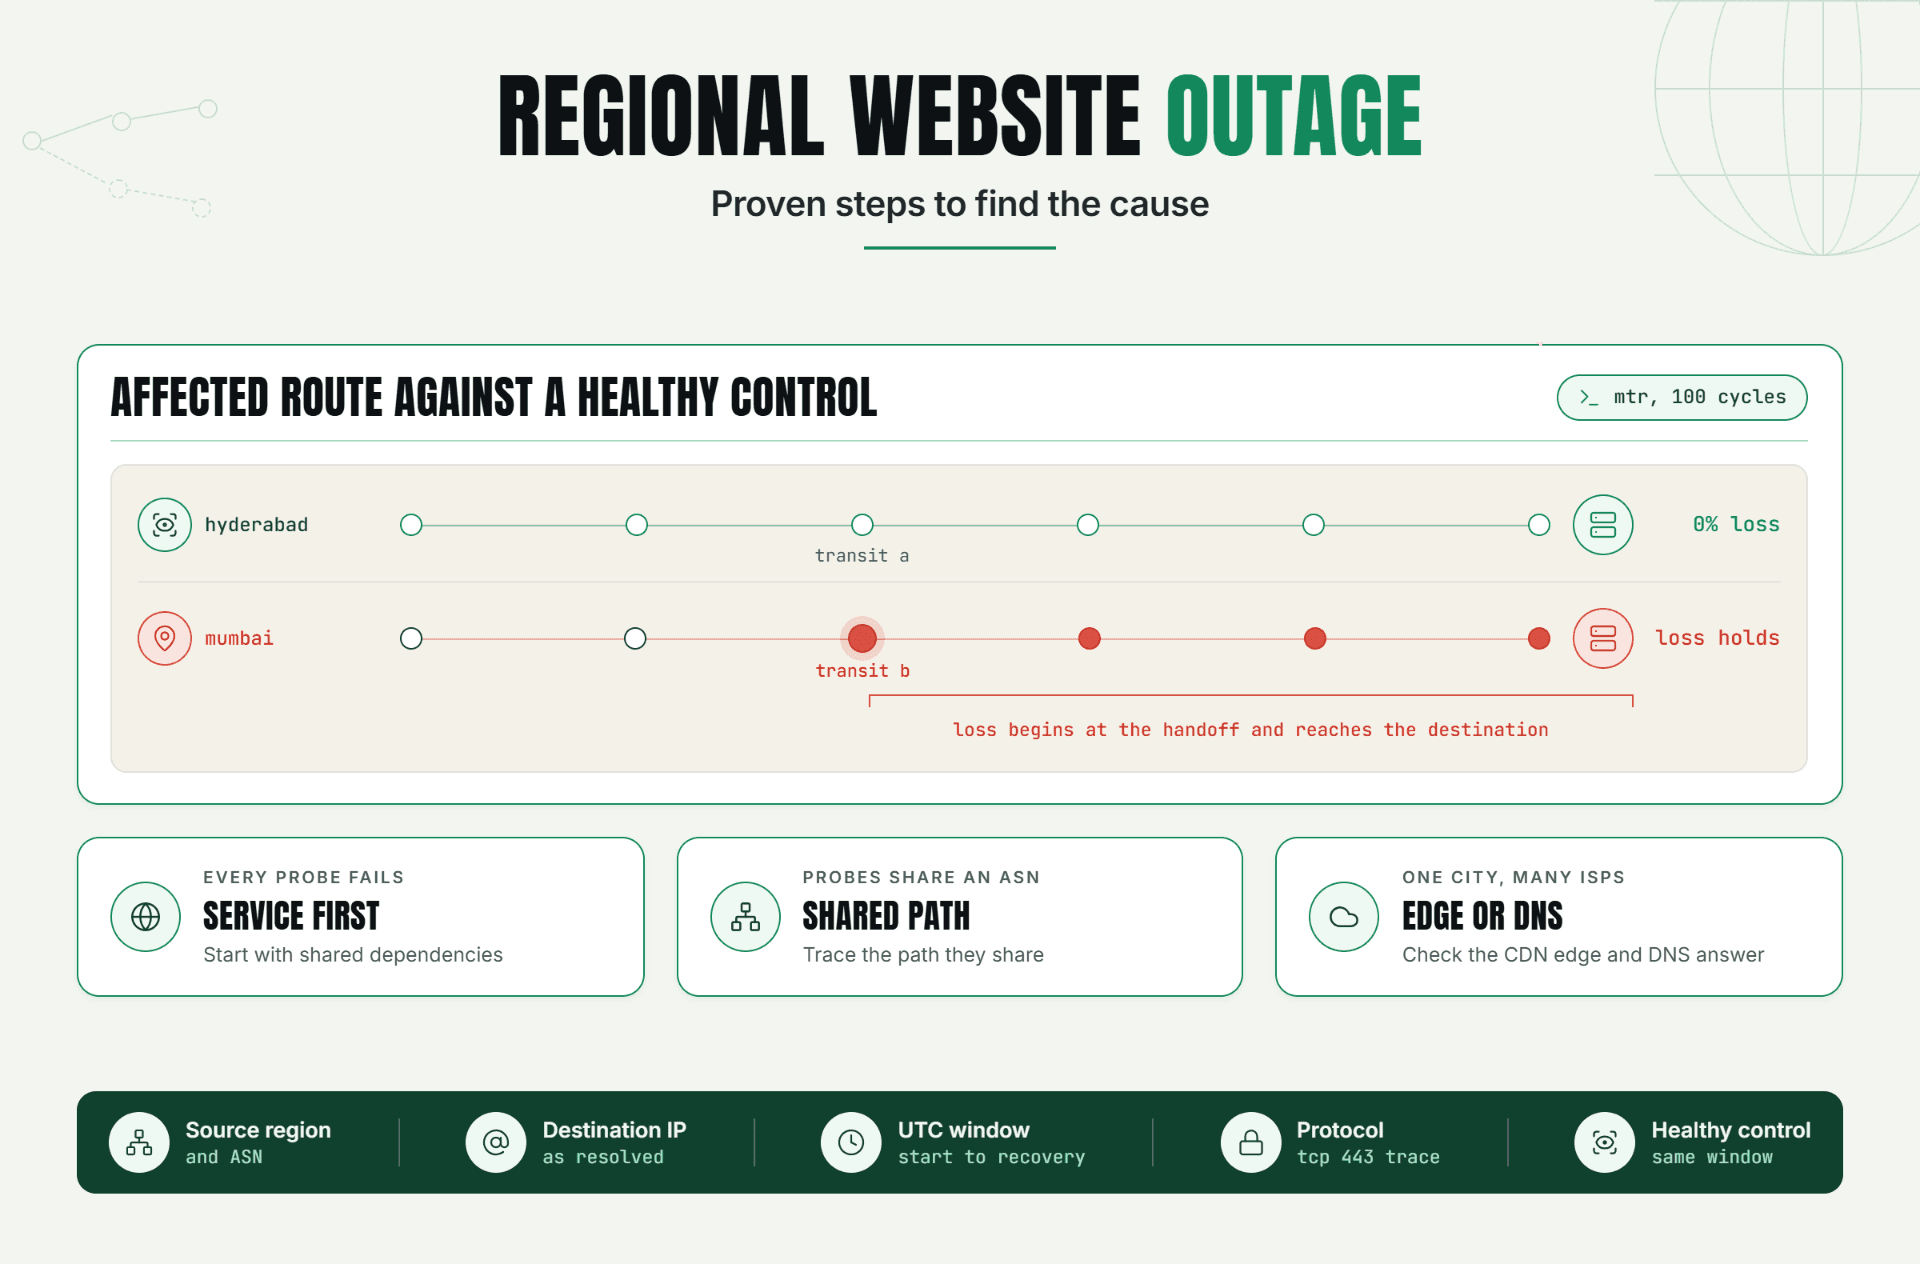
Probe location | Whether the failure is regional | Multiple locations agree |
Recovery result | Whether service is stable again | One or more confirmed successes |
Google's SRE guidance on monitoring distributed systems names latency, traffic, errors, and saturation as the four golden signals. A basic server port check directly observes latency and connection errors. Pair it with service metrics for traffic and saturation, because an external probe can't see queue depth, worker exhaustion, connection-pool pressure, or CPU contention.
Here's a useful statistical warning from the same Google SRE chapter: a service averaging 100 ms at 1,000 requests per second can still have 1% of requests take five seconds. Averages hide tails. For port monitoring, keep individual connect times or percentiles instead of trusting one weekly mean.
Thresholds for a useful port outage alert
One failed connection shouldn't automatically wake somebody at 3 a.m. Internet paths wobble. DNS resolvers stall. A single probe location can have trouble even when users don't.
Start with a timeout based on the service baseline, not a universal number. Then require repeated failure or confirmation from a second location before paging. A warning can fire earlier to chat; a page should mean a human needs to act now.
When one failure should be enough
Use a one-failure page only for a genuinely critical service when the probe is already validated by another location or an application-level check. Otherwise, one failure should open evidence collection, not a full escalation.
Statixoup says its monitoring uses intelligent validation to reduce false positives and supports 30-second checks. That makes a two-check threshold a practical starting point for critical endpoints: detection can happen quickly without turning every transient packet loss event into a port outage alert.
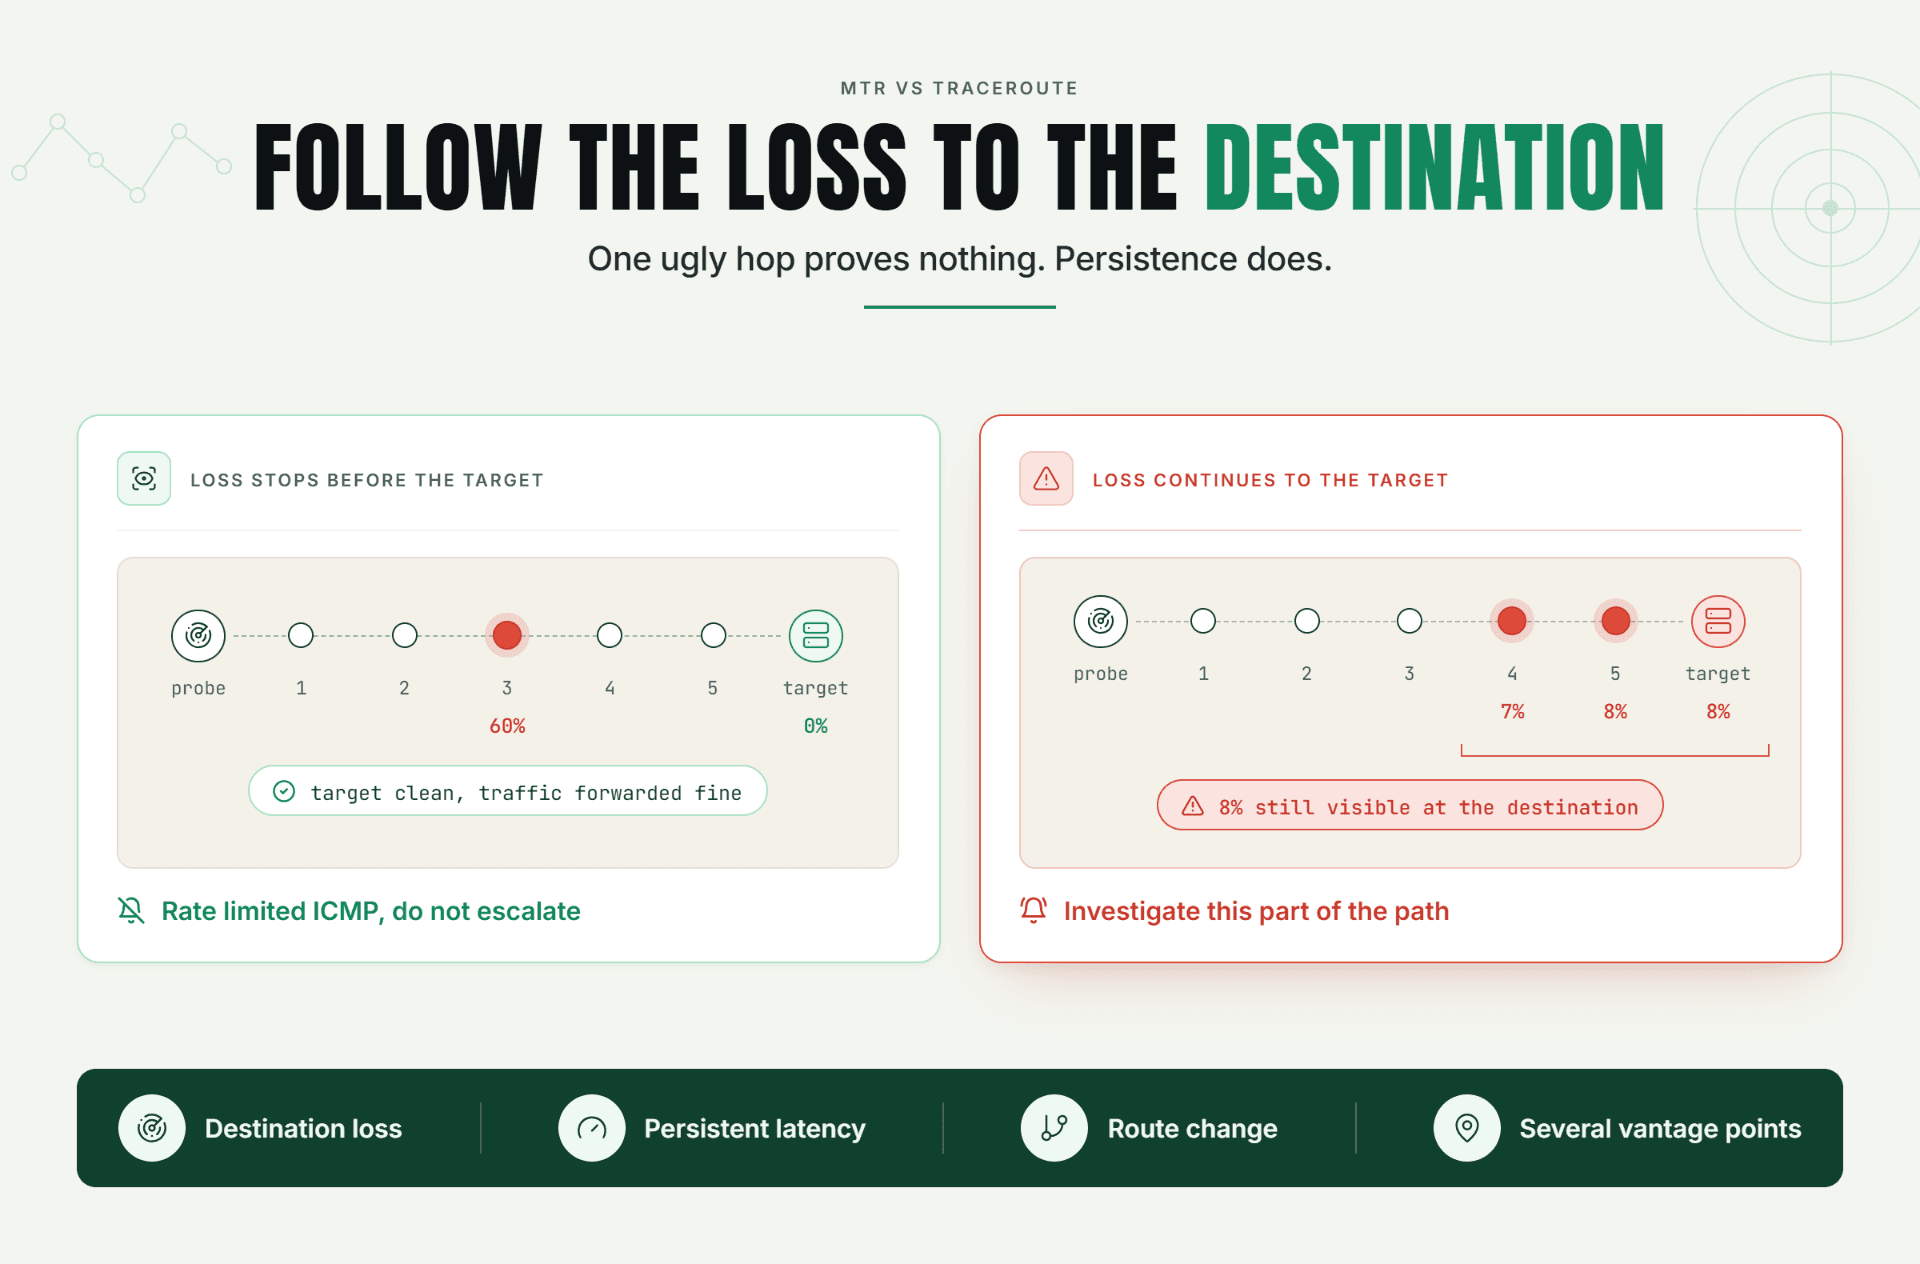
For broader diagnosis after an alert, Statixoup's MTR versus traceroute guide explains why repeated hop-by-hop measurement gives stronger evidence than a single path snapshot.
Configuring a reliable port monitor
Use this sequence:
1. Choose the real hostname and TCP port. 2. Set a timeout from observed normal latency. 3. Check every 30 to 60 seconds for a critical service. 4. Require two consecutive failures or multi-location confirmation. 5. Route warnings and pages to named owners. 6. force a controlled failure. 7. Confirm the recovery notification. The result is a monitor you have proved, not merely configured. |
|---|
Testing matters. Stop the listener in a maintenance window, block the probe temporarily at a test firewall, or target a disposable staging service. Then verify detection time, incident evidence, recipient, and recovery behavior.
Statixoup's documentation recommends starting with one reliable check, understanding its normal response, and then expanding coverage. The same discipline applies here. The Statixoup monitor-management documentation is the best place to confirm the currently available monitor settings before publishing screenshots or field-by-field instructions.
A realistic production setup
This is an illustrative scenario, not a Statixoup customer case study.
A hosting provider runs a customer control panel over HTTPS, a provisioning API on TCP 8443, PostgreSQL on 5432 inside a private network, and SMTP submission on 587. The public website monitor stays green during a deployment, but a new firewall rule blocks the provisioning API from the load balancer subnet.
What fails first? New server orders sit in “pending.” Existing customers can still log in, so the main HTTP check doesn't complain.
The first monitoring attempt is weak: one external server port check against 8443 with immediate paging. It catches the block, but it also pages twice the next week during brief routing loss from the probe region. The team starts distrusting it. That's almost worse than no alert.
They change the setup:
Service | Check | Interval | Failure rule | Route |
|---|---|---|---|---|
Control panel | HTTPS plus expected content | 30 seconds | Two failed checks | Primary on-call |
Provisioning API | TCP 8443 plus API health check | 30 seconds | Two failures or two regions | Platform on-call |
SMTP submission | TCP 587 plus protocol banner where supported | 60 seconds | Three failures | Messaging owner |
PostgreSQL | Internal synthetic query | 60 seconds | Two failures | Database owner |
Now the port monitor supplies fast reachability evidence, while the API check proves the application can respond. MTR or traceroute evidence helps separate a routing problem from a dead listener. The recovery alert closes the loop.
This layered setup matters because Uptime Institute reports that four in five respondents believed their most recent serious outage could have been prevented with better management, processes, or configuration. Monitoring won't fix a firewall rule. It can shorten the silent period and point the responder toward the right layer.
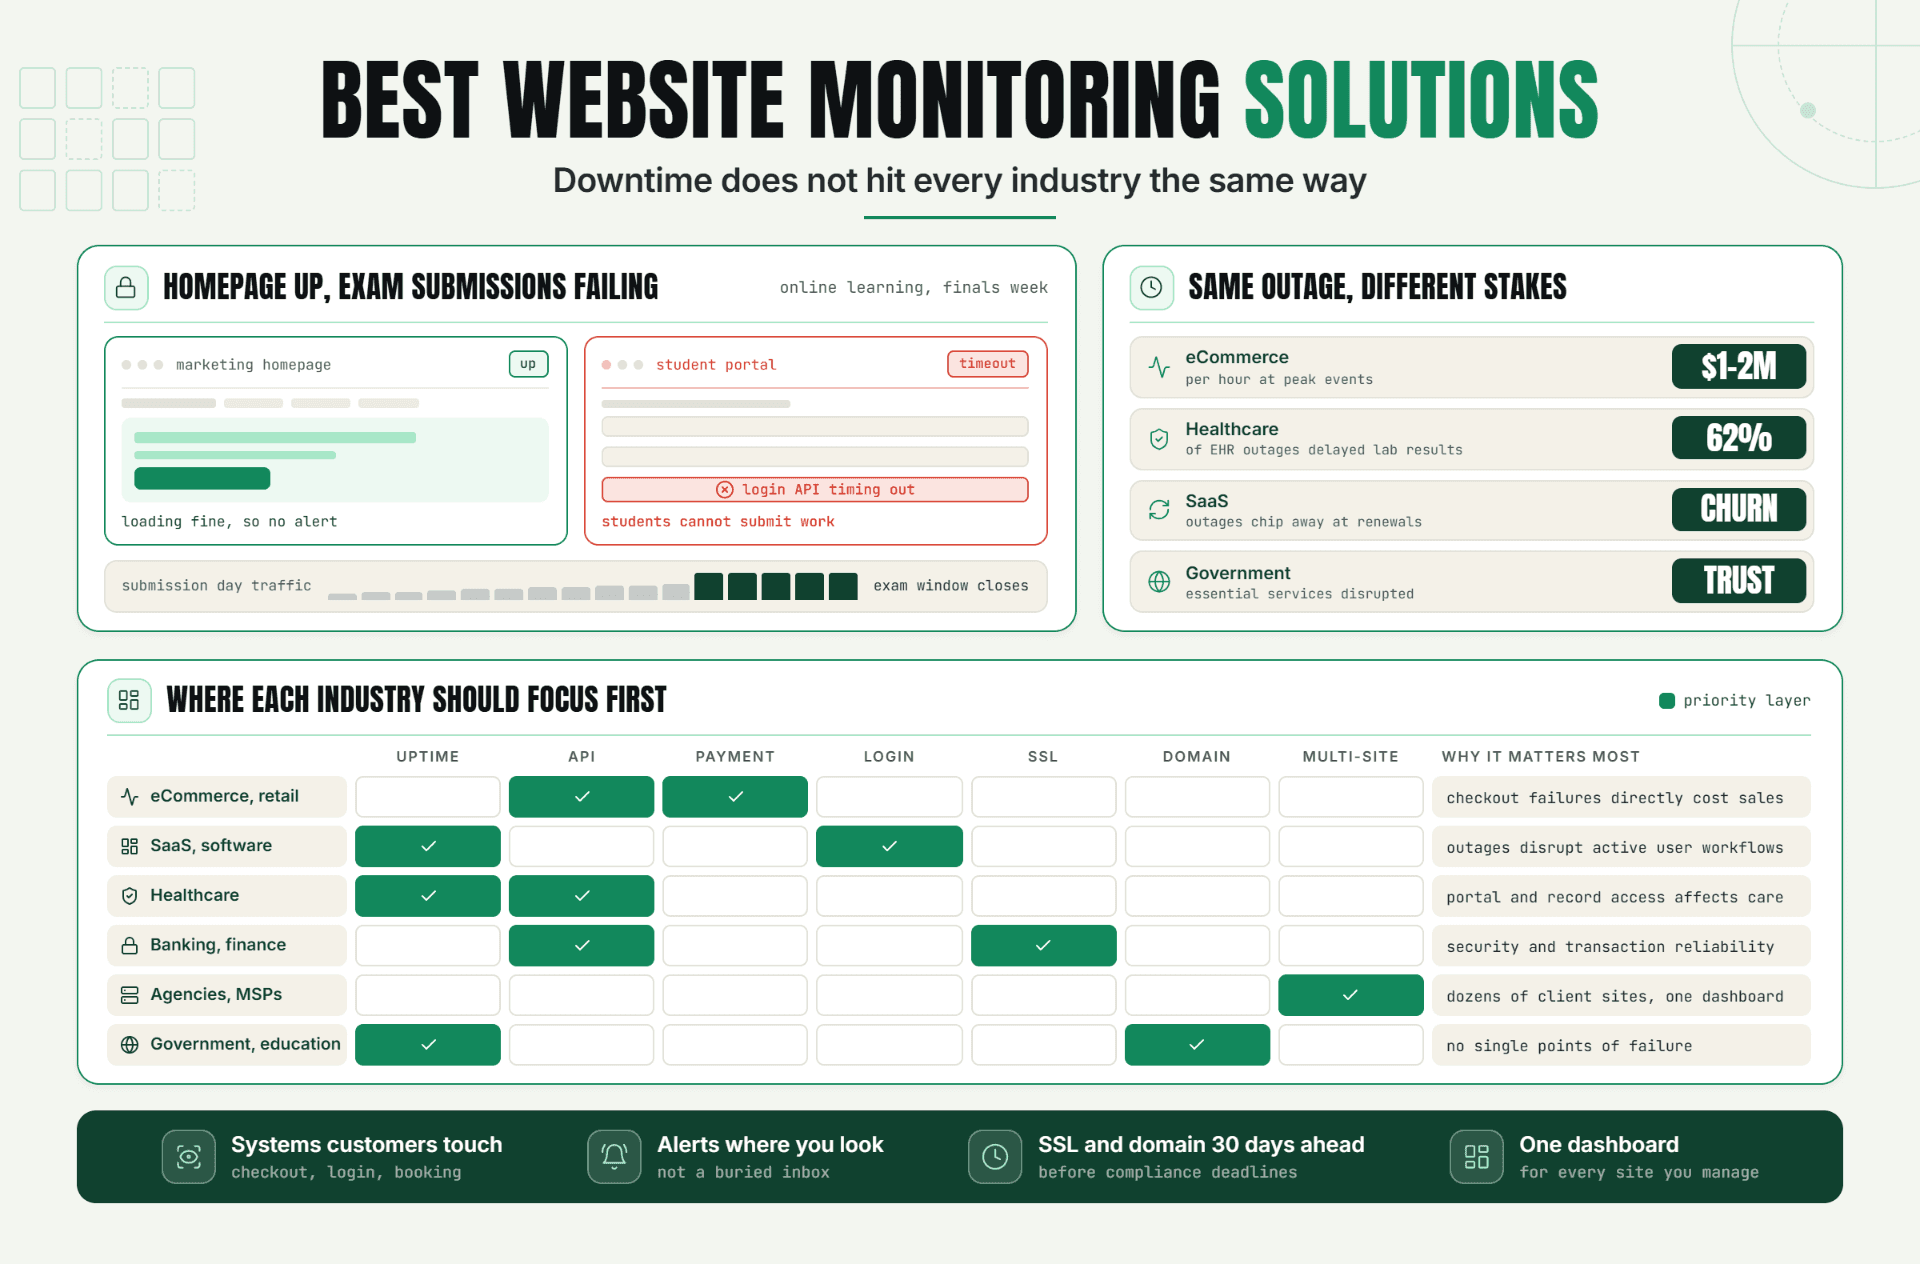
If you need the wider monitoring context, Statixoup's guide to website monitoring solutions by industry maps coverage to different operating models. Its article on complete website monitoring services also explains why uptime, APIs, certificates, and domains need coordinated checks.
Best practices that keep alerts useful
Cover services by user impact
Monitor every externally important TCP dependency, but prioritize the path users actually need. A forgotten admin port doesn't deserve the same page as the payment gateway. Tag each check with service, environment, tier, and owner so an alert arrives with context.
Keep the port monitoring inventory beside the service catalog. That makes missing owners and retired endpoints much easier to spot.
Pair reachability with a deeper check
Use port monitoring to prove network reachability. Use an application transaction to prove useful work. For SMTP, that may be a banner or test delivery. For a database, use a read-only synthetic query from a permitted internal probe. For HTTPS, validate status, content, and certificate behavior.
This pairing turns a basic port check into evidence a responder can act on.
Match frequency to the service objective
Run critical checks every 30 to 60 seconds when minutes of silent failure matter. Less critical internal services can run every few minutes. Google SRE notes that a service targeting 99.9% annual availability may not need HTTP probing more than once or twice a minute. Frequency should follow the service objective, not habit.
Validate routing before launch
Every port outage alert needs one accountable owner, one backup route, and a useful escalation delay. Test the warning, page, acknowledgement, and recovery paths. Statixoup documents Slack, Discord, WhatsApp, and SMS integrations; choose the channel the responder already watches.
Review the monitor after changes
Firewall moves, load-balancer replacements, DNS migrations, and port changes can invalidate a once-good check. Review coverage during change planning and after incidents. Otherwise, the dashboard slowly becomes a museum of services that no longer exist.
Quarterly review is a sensible default for stable systems. Fast-changing platforms should audit their port monitors after every material network change.
Common mistakes
Treating “port open” as “service healthy”
This happens because TCP connection success is easy to measure. Fix it by adding an application-level check for the transaction users need.
Paging on the first failure
Teams want the fastest alert, so they remove validation. The result is noise. Use consecutive failures or multi-location agreement unless one missed check genuinely warrants an immediate page.
Monitoring only from inside the network
An internal probe may succeed while an edge firewall blocks customers. An external probe can miss a private dependency. Use both when the service path crosses both boundaries.
Forgetting dependencies
A healthy port can front a broken database, DNS provider, certificate, queue, or upstream API. Map the request path and give each critical failure mode an appropriate check. Statixoup's SSL certificate monitoring guide covers one dependency teams routinely miss.
Sending every alert to everyone
Broadcast routing feels safe. It usually creates diffusion of responsibility. Route by service ownership, severity, and time of day, with a clear fallback when nobody acknowledges.
Conclusion
Port monitoring closes a specific and expensive blind spot: the service can stop accepting connections while the surrounding website still looks alive. The check is simple. Designing one that people trust takes baselines, validation, deeper health checks, and ownership.
Start with one critical TCP service. Prove the failure path. Then expand.
Post a Comment

Hardik Vaghani
Hardik Vaghani is a Digital Marketing Professional and SEO Strategist based in Surat, Gujarat, India. He currently works with Ethnic Infotech, contributing to SEO, content marketing, technical SEO, and digital growth strategies. Hardik also creates blog content for Fusion5, focusing on technology, laptops, and consumer electronics. With expertise in SEO, Google Ads, Meta Ads, Local SEO, and Content Strategy, he helps businesses improve online visibility, rankings, and lead generation through data-driven marketing.
Frequently Asked Questions
Related Blogs