Regional Website Outage? Proven Steps to Find the Cause
The blog explains why global uptime dashboards can look healthy even while a specific region, ISP, or metro can't reach the site. It walks through a step-by-step diagnosis process using HTTP checks, DNS comparison, traceroute, and MTR to pinpoint whether the failure sits with an ISP, CDN edge, transit link, or the origin itself.
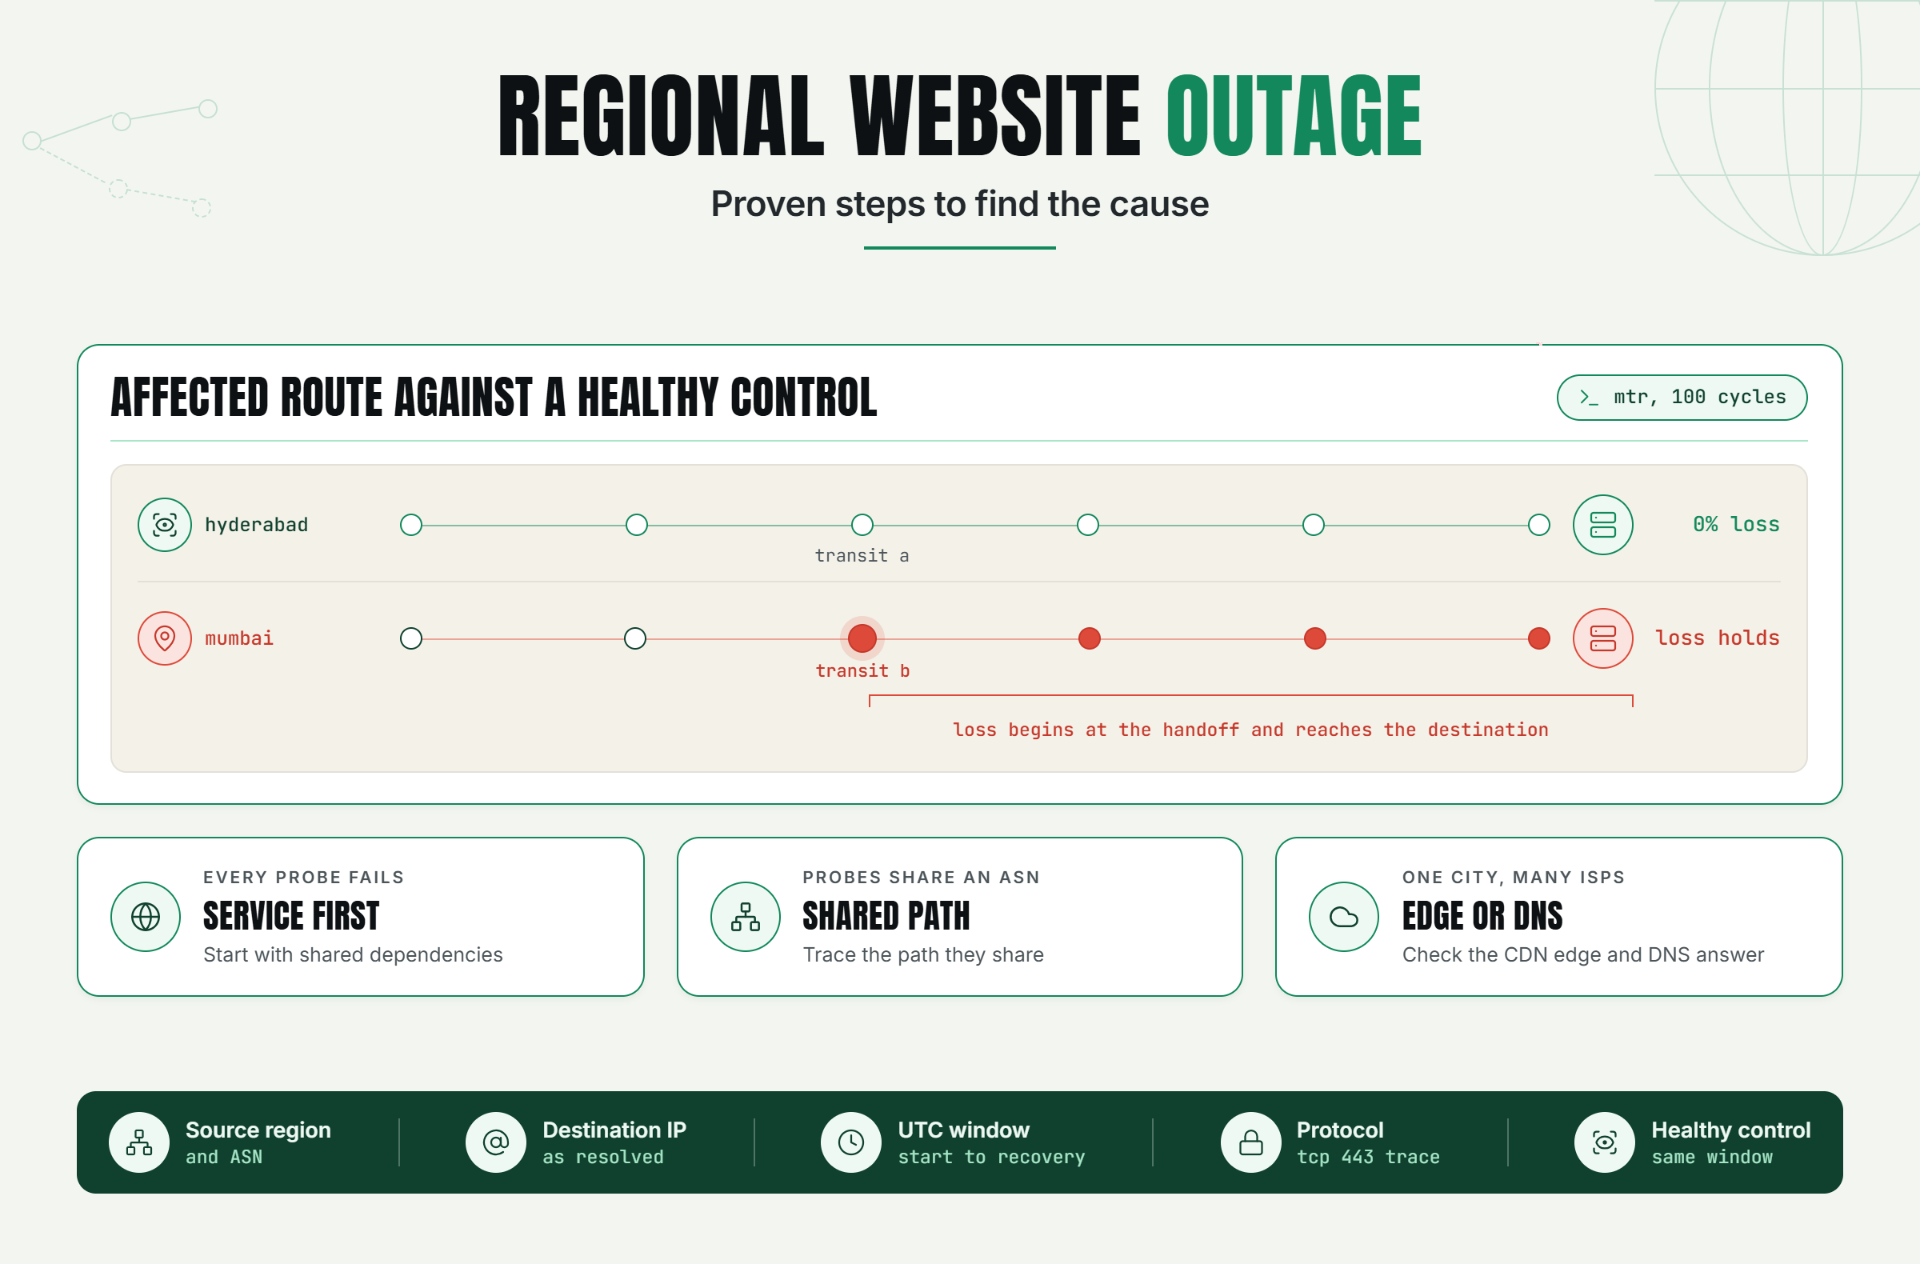
The direct answer is simple: confirm the failure from at least two affected locations and one healthy control, compare DNS and HTTP results, then run traceroute and MTR from both sides. A path change, sustained loss that continues to the destination, or a sharp latency increase across later hops can narrow a regional website outage to an ISP, transit provider, CDN edge, or origin route. Don't diagnose from one trace. Routes move, routers rate-limit probes, and a clean control path is part of the evidence.
That distinction matters. “The site is up” is meaningless to the buyer who can't reach it. And time disappears fast. The wrong diagnosis burns the first 20 minutes on application logs while the affected traffic never reaches the application at all.
The Operational Problem: Green Globally, Broken Locally
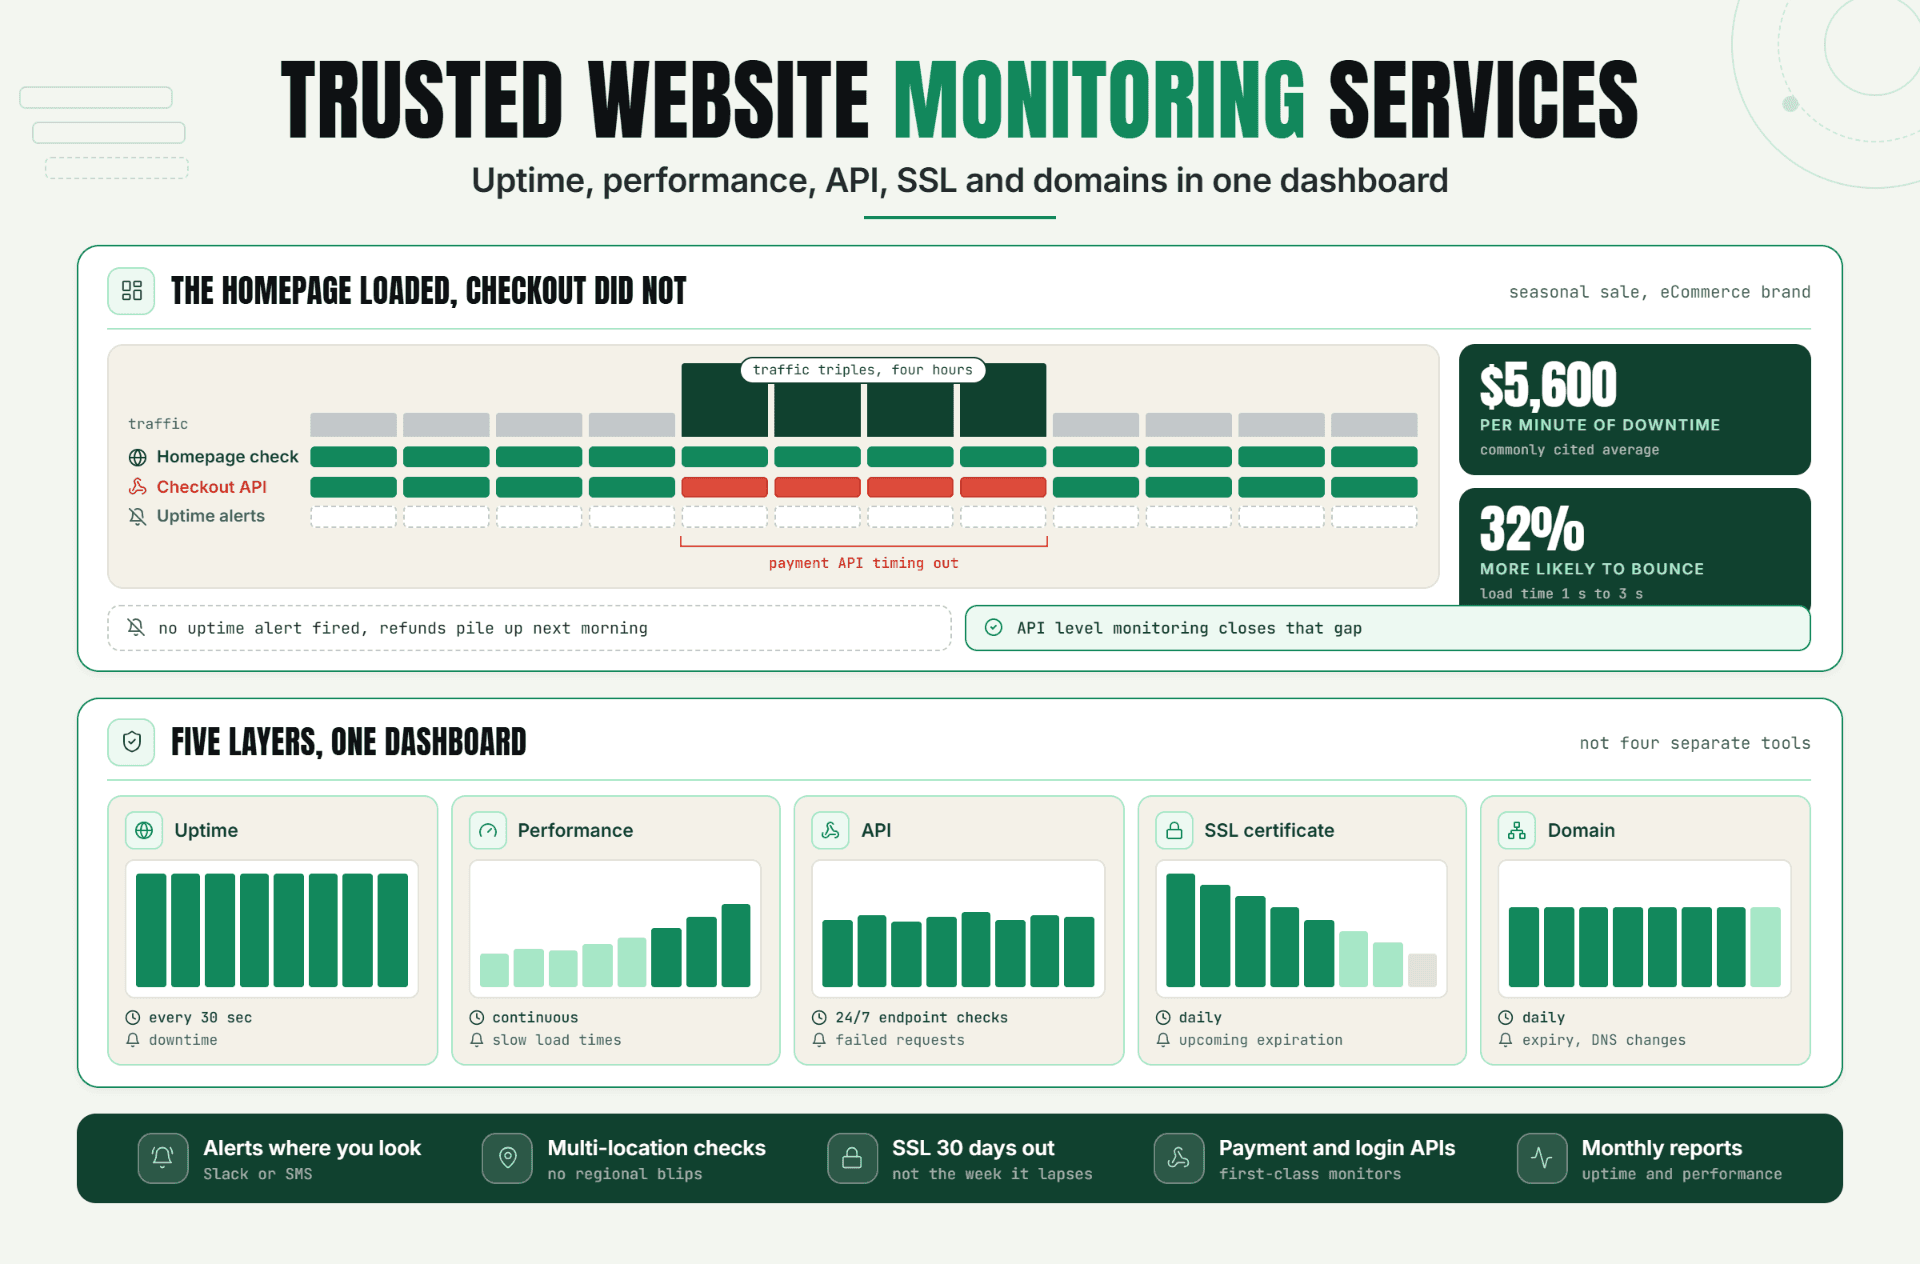
A regional connectivity issue creates an awkward split in the evidence. Global uptime remains above the alert threshold. CPU, memory, and error rates stay normal. Yet one country, metro, or ISP can't complete the request. That region-specific outage can stay invisible in a worldwide aggregate.
Without multi-location uptime monitoring, teams often treat those reports as browser problems. Support asks customers to clear their cache. Engineering rolls back a harmless release. The network team gets a screenshot with no timestamp, source IP, destination IP, or route. Meanwhile, the regional website outage continues.
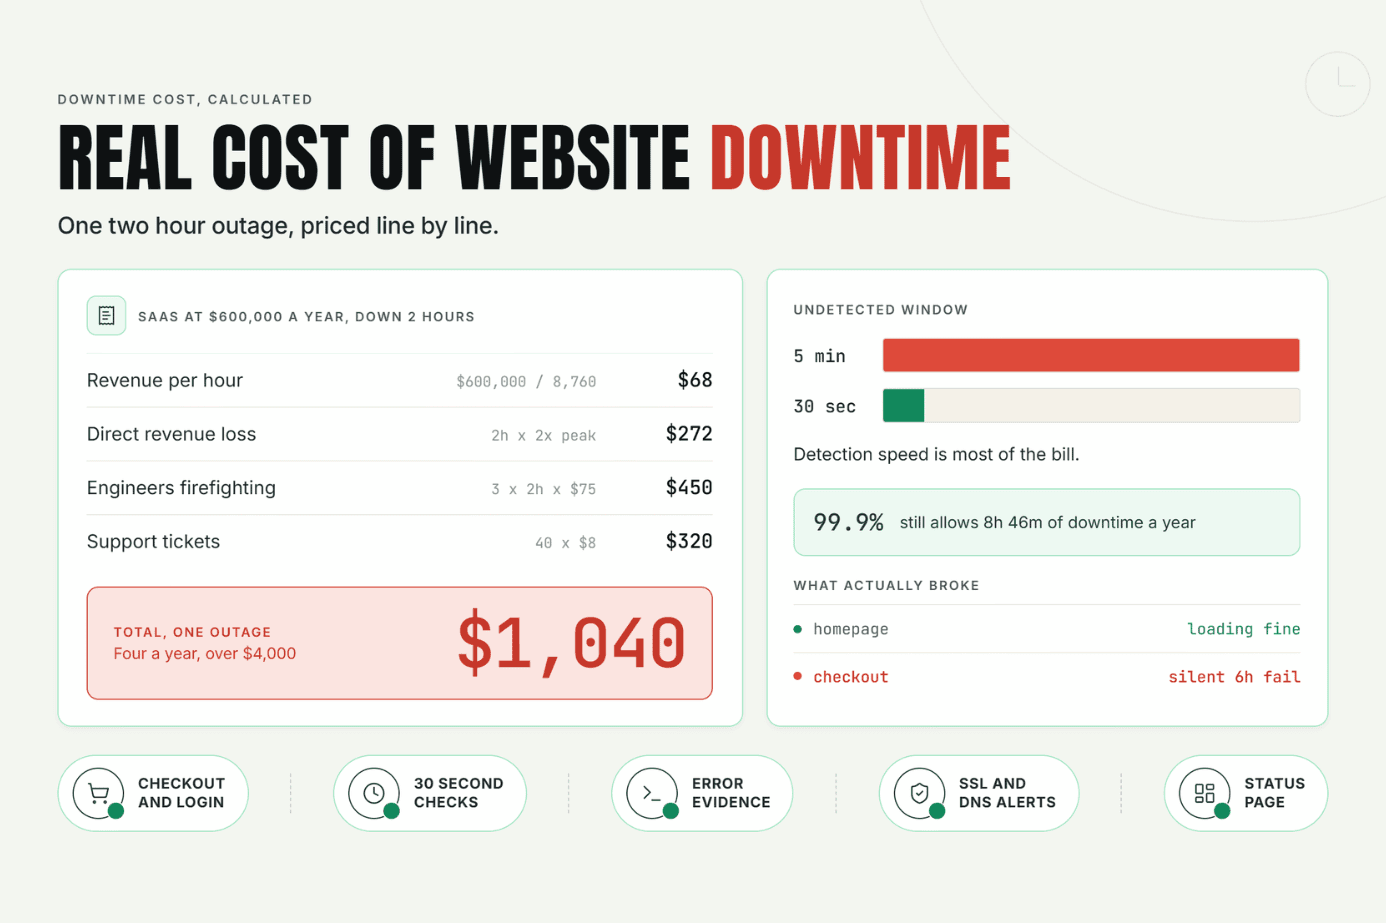
The cost isn't only lost sessions. Response time gets wasted too. That hurts twice. Statixoup's guide to the real cost of website downtime explains why detection speed changes the final impact, while its overview of website monitoring solutions shows why coverage has to match the system being protected.
How a Regional Website Outage Actually Works
A regional website outage is a reachability or performance failure limited to a geographic area, access network, or routing path. The origin may be fully available. The failure can sit in DNS resolution, an ISP edge, a transit link, a CDN point of presence, a peering relationship, or a route to the origin.
The useful distinction is scope. If every probe fails, start with the service and its common dependencies. If only probes sharing a region or ASN fail, investigate the path they share. If one city fails across several unrelated ISPs, inspect the CDN edge, DNS answer, or regional cloud endpoint. That's the condition-action pattern that keeps a regional website outage response focused.
Google's Site Reliability Engineering guidance names four golden signals: latency, traffic, errors, and saturation. That is a useful application view, but a regional website outage needs a fifth operational lens: location. A global average can hide a complete failure in a smaller market. See the Google SRE monitoring guidance for the original four-signal model.
Signals and thresholds that deserve attention
Don't create a universal “50 ms is bad” rule. Baselines differ by route and distance. Use change from the normal regional baseline, destination success, and persistence together.
|
|
|
|---|---|---|
|
|
|
|
|
|
|
|
|
|
|
|
|
|
|
These aren't laws. For a payment endpoint, two failed 30-second checks may justify paging. Documentation can wait longer. The alert should match customer harm.
Traceroute diagnosis: use the path as a lead, not a verdict
Traceroute sends probes with increasing time-to-live values. Each expired probe can produce a response from an intermediate router, building a hop-by-hop view toward the destination. The Linux traceroute manual documents a default maximum of 30 hops, which is a limit of the tool's default search, not proof that an internet route should contain 30 devices. See the Linux traceroute manual.
One trace is a snapshot. It is still useful. It can reveal an obvious stop, a major latency step, or a different transit path between an affected region and a healthy control. But wait. Asterisks aren't a verdict. Firewalls may filter probes, and routers may deprioritize the ICMP responses used by diagnostic tools while forwarding customer traffic normally. A regional outage diagnosis must account for that behavior.
Run a protocol that resembles production traffic when possible. If users reach HTTPS on TCP 443, compare the default trace with a TCP-based trace to port 443. Also record the resolved destination first. Tracing the wrong CDN address creates tidy evidence for the wrong path.
MTR troubleshooting: measure persistence across the route
UnderstandingMTR vs traceroute helps teams choose between a single route snapshot and repeated latency and packet-loss measurements.. Its official MTR manual reports round-trip times in milliseconds and packet-loss percentages, and it states that the default probe interval is one second. The manual also warns that MTR can create meaningful network traffic, so don't run aggressive continuous tests without limits. See the official MTR manual.
How to read intermediate-hop loss correctly
If hop 6 shows 40% loss but hops 7 through the destination show 0%, hop 6 is probably rate-limiting its own replies. It is still forwarding the later probes. Don't declare a routing outage from that row.
Persistent loss is different. If it begins at hop 6 and roughly continues through every later hop, the evidence is more serious. Compare the pattern with a healthy control. Then repeat the report. A congested or broken link near hop 6 is now a credible lead in the regional connectivity issue, though not yet a final root cause.
The opinion here is firm: destination behavior outranks a scary red number in the middle of an MTR table. Too many incident channels lose time blaming the first hop that doesn't answer every probe.
A step-by-step regional outage diagnosis
- 1. Confirm scope. Run HTTP checks from two affected locations, one nearby location, and one distant control. Record UTC timestamps, status codes, latency, and response validation.
- 2. Check name resolution. Compare A and AAAA answers, resolver used, TTL, and the actual IP reached in each region.
- 3. Test the service. Use an HTTP or TCP check against the same hostname, port, redirects, and TLS behavior customers use.
- 4. Capture traceroute. Run it from the affected region and the healthy control. Prefer TCP 443 when ICMP or UDP treatment differs from production.
- 5. Run bounded MTR reports. Capture 100 cycles from both locations, with numeric addresses and timestamps. Repeat during and after the regional website outage.
- 6. Compare the paths. Find the first meaningful divergence, then check whether delay or loss persists through subsequent hops to the destination.
- 7. Correlate dependencies. Review CDN, DNS, cloud, transit, and ISP status. Check application telemetry to see whether affected requests arrived.
- 8. Escalate with evidence. Send the source region or ASN, destination IP, UTC window, protocol, trace, MTR report, and healthy control.
The result is a compact evidence package that another operator can reproduce. It also stops the incident from becoming an argument between application and network teams.
What Actually Happens During a Regional Connectivity Incident
Consider this clearly labeled illustrative scenario. A SaaS dashboard runs behind a CDN, with its origin in Europe. At 10:02 UTC, support receives reports from users on two ISPs in western India. London, Frankfurt, and Singapore synthetic checks remain healthy.
The team checks application errors first. Nothing moves. That isn't comforting. The failed requests may not reach the application.
At 10:05, an affected Mumbai probe resolves the expected CDN IP but times out on HTTPS. A second Mumbai probe on another access network also fails. Hyderabad succeeds. The incident is now regional rather than global, but its boundary remains unclear.
Traceroute from Mumbai crosses a different transit ASN than the healthy Hyderabad trace. A 100-cycle TCP MTR report shows loss beginning at the handoff into that transit path and continuing toward the destination. The healthy control doesn't use that handoff. A second report five minutes later repeats the pattern.
The team sends the CDN and transit provider both reports, the destination IP, UTC timestamps, affected source networks, and the successful control. The provider shifts traffic away from the suspect path. HTTP checks recover, and post-change MTR reports no longer show destination loss. The region-specific website outage is closed only after both affected probes recover.
One check didn't help. Refreshing the homepage from an engineer's laptop in London proved nothing. The route comparison did.
Recommended monitor setup
|
|
|
|
|
|---|---|---|---|---|
|
|
|
|
|
|
|
|
|
|
|
|
|
|
|
|
|
|
|
|
For notification delivery, Statixoup publishes real setup pages for Slack uptime alerts and Discord uptime alerts. Route warnings to an owned channel, not a room everyone mutes.
Best Practices for Monitoring Region-Specific Failures
Cover customer paths, not a map
Choose locations based on revenue, user concentration, and network diversity. Two probes in one cloud region aren't independent just because they have different names. Use different providers or access networks where the regional website outage risk justifies it.
Separate detection from diagnosis
HTTP checks should detect customer harm. Traceroute and MTR should explain the path after an alert. Continuous, high-frequency path probing adds noise and traffic; bounded reports tied to an incident produce cleaner evidence.
Keep a healthy control
A control answers one question: what changed? Without it, every changed hop looks suspicious. With it, the regional outage becomes a comparison rather than a guessing exercise.
Assign ownership before the page fires
Name the team that validates the alert, the person who contacts the CDN or ISP, and the place where reports are stored. A regional connectivity incident moves faster when those decisions are already made. Review escalation templates quarterly because destinations, providers, and on-call rotations change.
Validate the response, not just status 200
A CDN error page can return HTTP 200. So can a login shell whose API calls are failing. Check a small piece of expected content or a safe transaction. Statixoup's guide to trusted website monitoring services provides broader context on layered reliability checks.
Common Mistakes That Turn a Routing Outage into Noise
Treating one failed probe as a region-wide failure
The probe host itself may be unhealthy. Confirm from a second vantage point or provider in the same region, then compare with a healthy control. A regional connectivity issue needs shared evidence, not one red dot.
Blaming the first hop with packet loss
Intermediate routers often give diagnostic traffic lower priority. If later hops and the destination answer normally, the intermediate row isn't evidence of customer loss. Look for persistence downstream.
Testing ICMP when customers use HTTPS
Networks can handle ICMP, UDP, and TCP differently. Repeat the traceroute diagnosis with TCP 443 when the service is HTTPS. Match IPv4 or IPv6 to the failing customer path too.
Ignoring DNS and CDN selection
Two regions may receive different addresses by design. Trace the IP each probe actually resolved. Otherwise, a healthy trace to the origin says nothing about the failing CDN edge.
Paging on latency without a baseline
Distance adds latency. A 180 ms round trip may be normal for one route and disastrous for another. Alert on sustained deviation and failed customer checks, not a global number copied from a dashboard template.
Conclusion
The lesson is blunt. Global green doesn't cancel regional red. A regional website outage becomes diagnosable when teams compare affected and healthy paths, validate the real customer transaction, and treat MTR as evidence rather than a blame generator.
Start by mapping the three markets where a missed regional outage would hurt most. Put independent checks there, choose one healthy control, and write the escalation template before the first alert.
Start Monitoring Regional Failures
Start a 30-day Statixoup trial and configure HTTPS checks for two priority customer regions plus one control location. Add response validation, connect the alert to the channel your on-call team actually watches, and save a traceroute and MTR evidence template in the runbook.
Post a Comment

Hardik Vaghani
Hardik Vaghani is a Digital Marketing Professional and SEO Strategist based in Surat, Gujarat, India. He currently works with Ethnic Infotech, contributing to SEO, content marketing, technical SEO, and digital growth strategies. Hardik also creates blog content for Fusion5, focusing on technology, laptops, and consumer electronics. With expertise in SEO, Google Ads, Meta Ads, Local SEO, and Content Strategy, he helps businesses improve online visibility, rankings, and lead generation through data-driven marketing.
Frequently Asked Questions
Related Blogs