Multi-Tenant SaaS Monitoring: Find Hidden Outages Fast
Learn how multi-tenant SaaS monitoring uncovers customer-specific outages that global uptime metrics often hide. This guide explains tenant-aware telemetry, synthetic checks, alert routing, and practical steps to protect critical SaaS workflows.
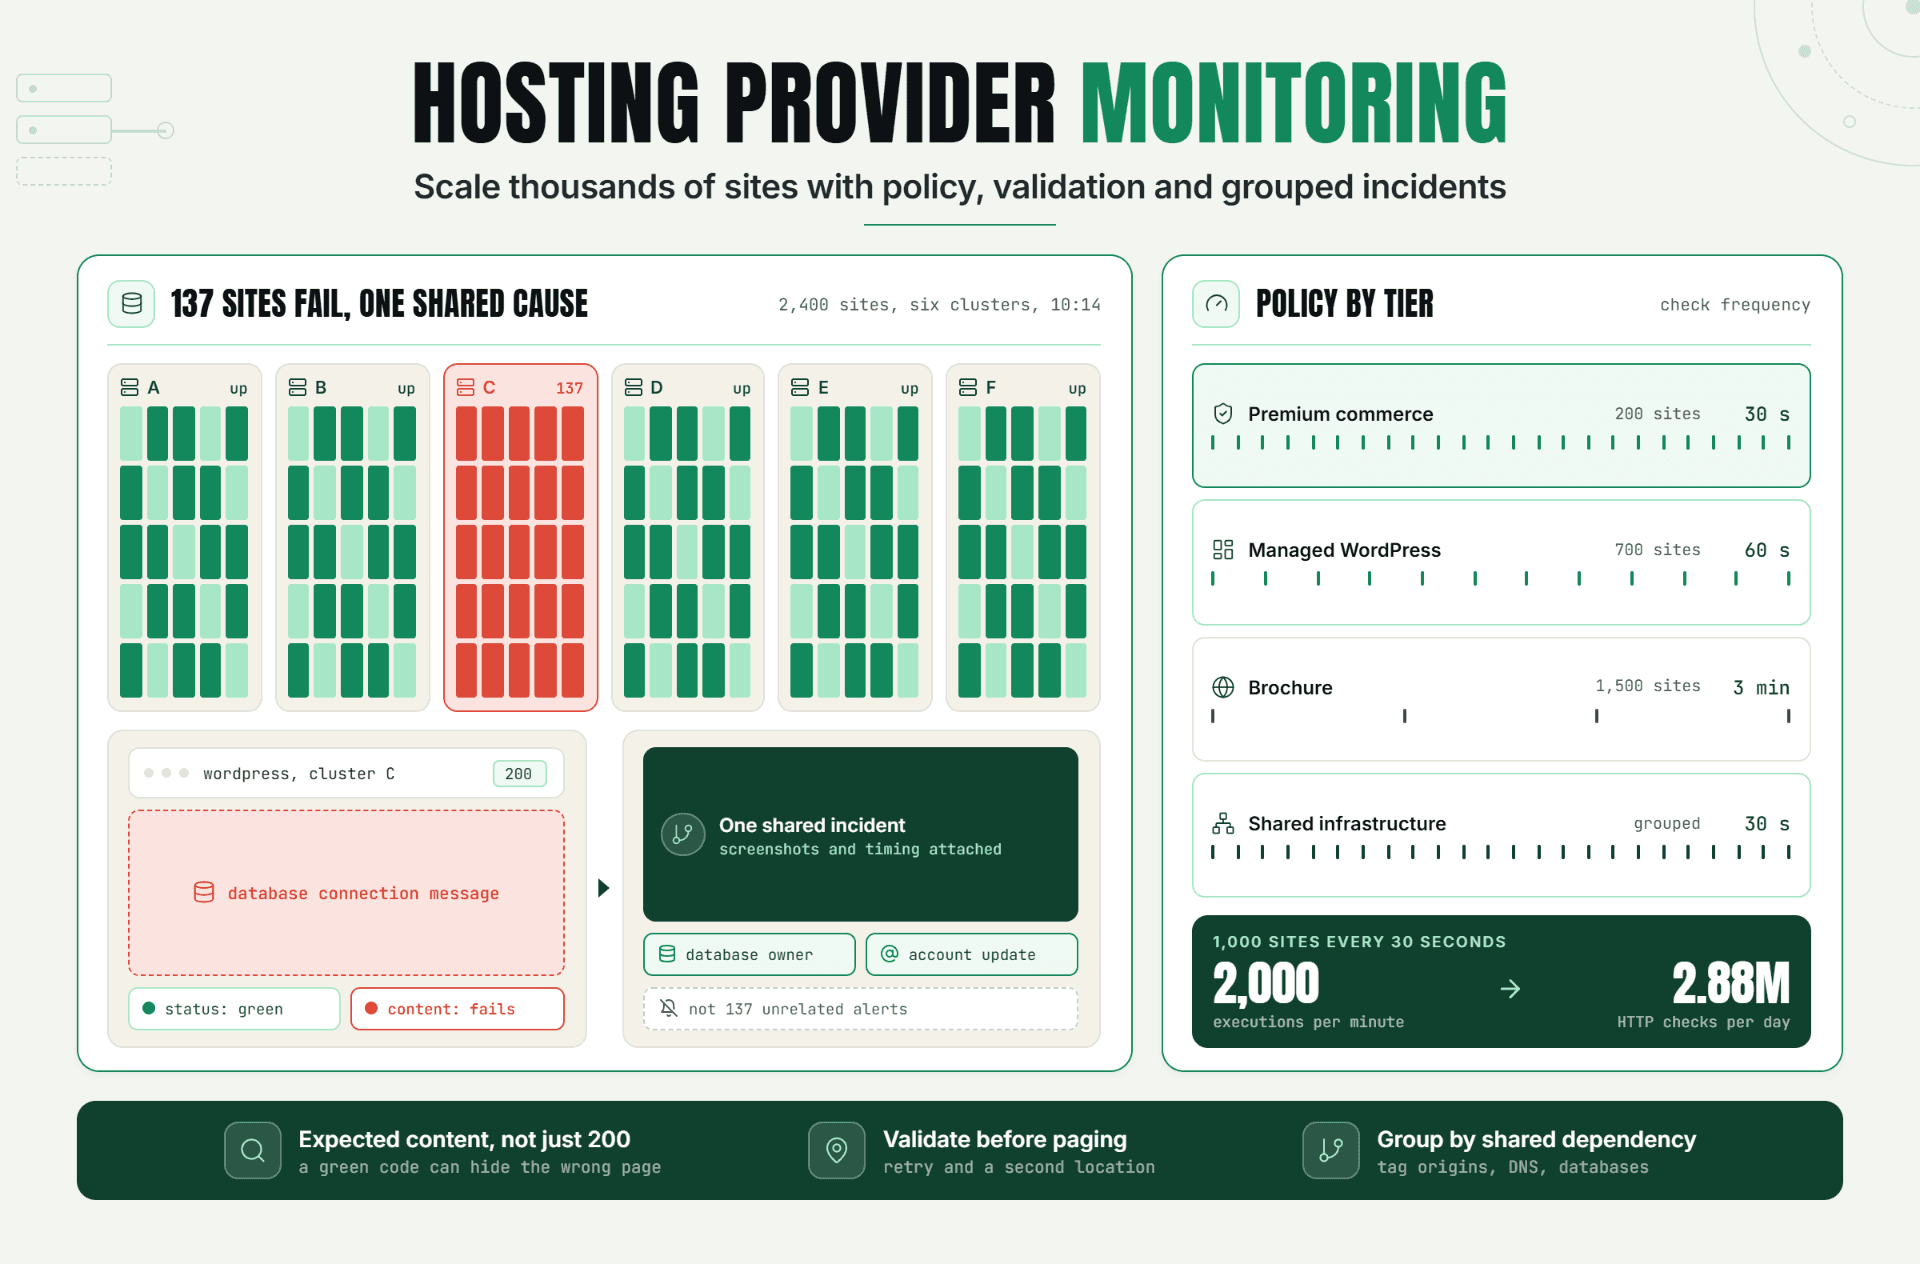
Statixoup monitors websites, APIs, browser journeys, SSL, DNS, ports, and scheduled jobs at intervals as short as 30 seconds. For a multi-tenant product, the useful part isn’t another green homepage check. It’s testing whether distinct customer contexts can still log in, retrieve their own data, and complete the workflows they pay for.
Here’s the short answer. Multi-tenant SaaS monitoring measures availability and performance by tenant, tier, region, shard, and workflow instead of averaging every customer into one global result. It catches a SaaS partial outage when one account, database partition, permission path, or feature-flag cohort fails while most traffic remains healthy.
The Problem: A Green Dashboard Can Still Hide an Angry Customer
Global availability answers, “Can somebody reach the service?” Your support queue asks a harder question: “Can this customer use their account right now?” Those aren’t the same test.
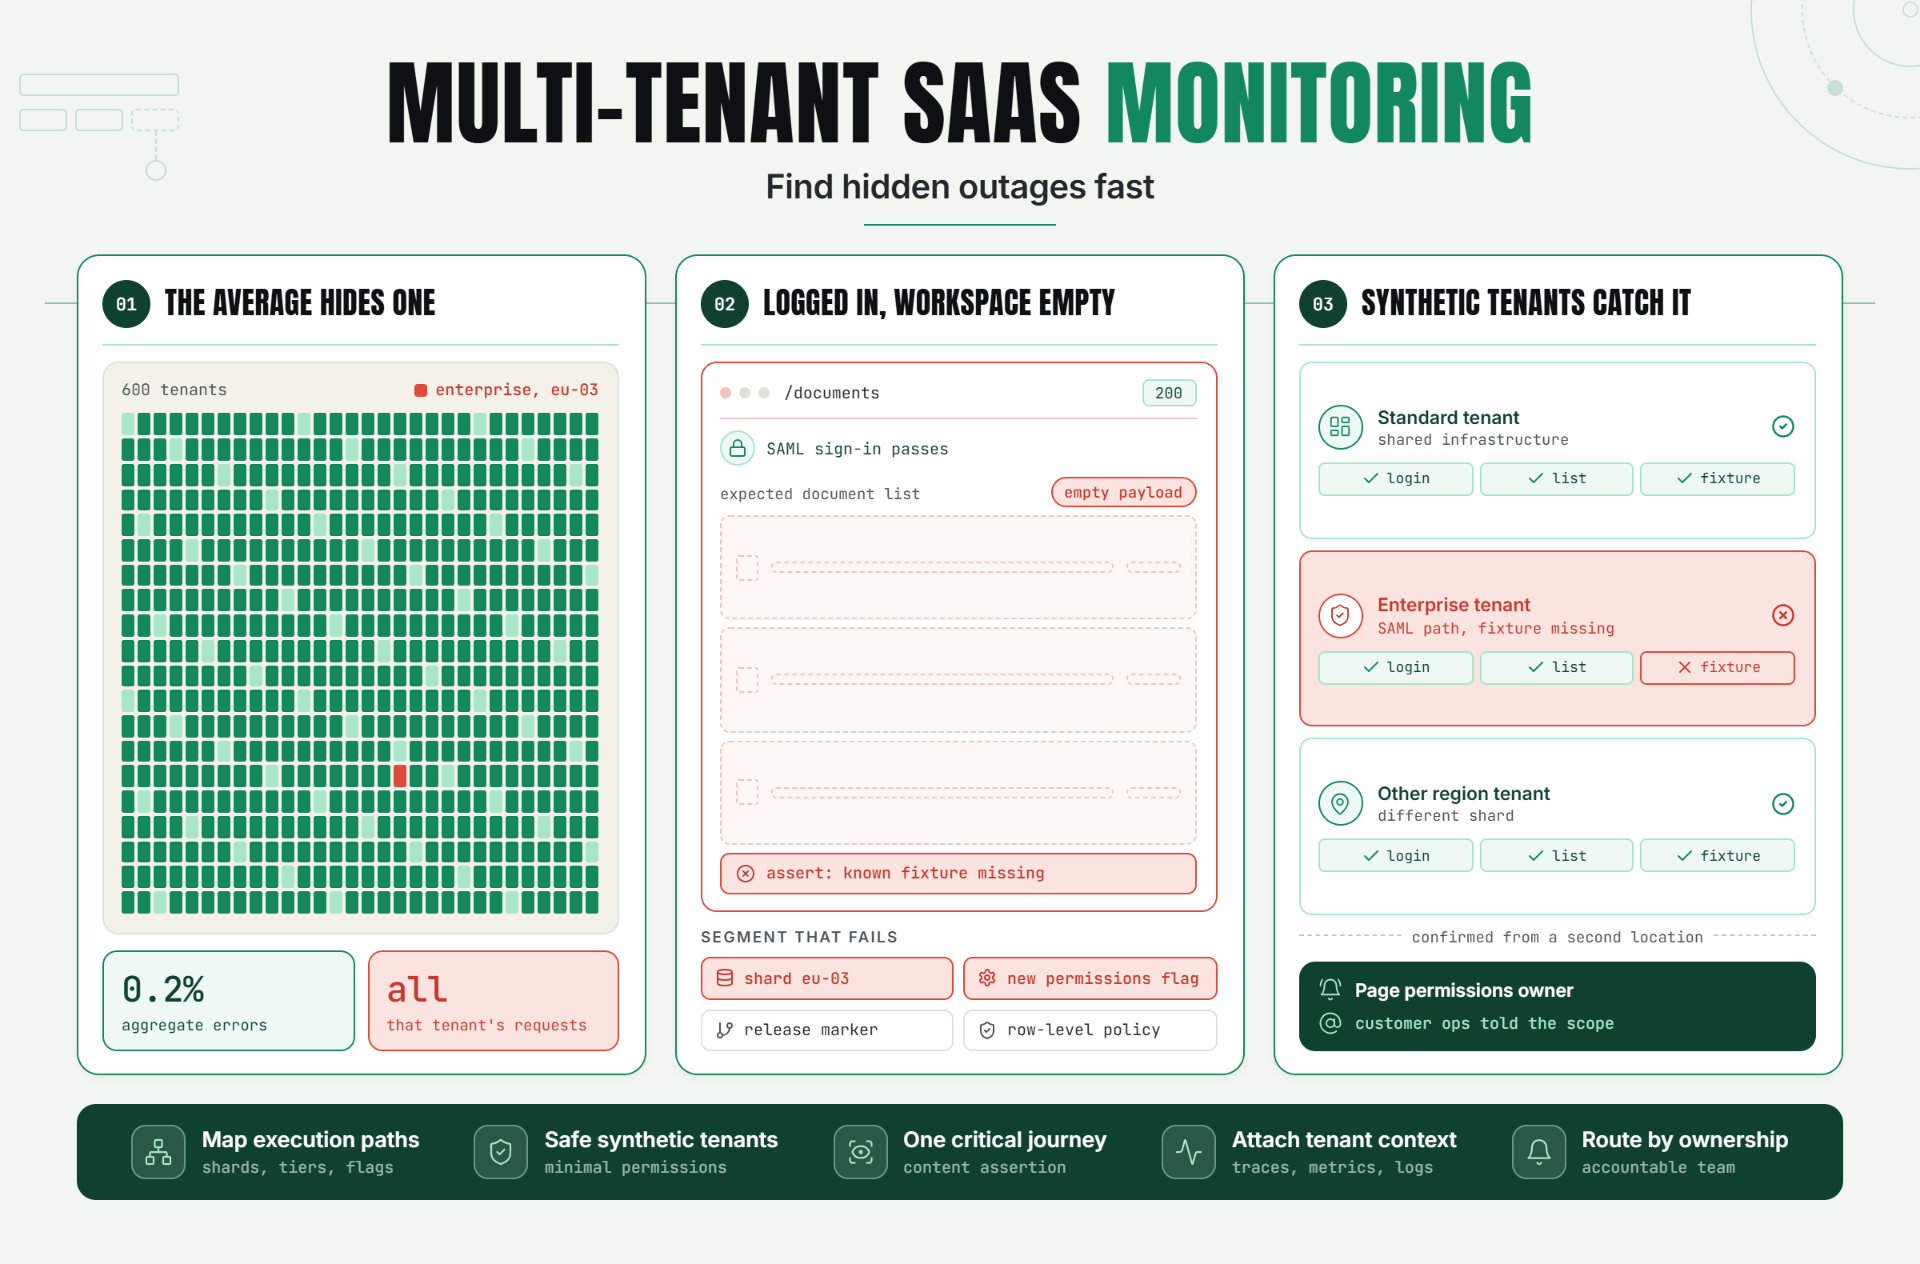
An aggregate error rate of 0.2% can look harmless. But if every failed request belongs to one enterprise tenant routed to a damaged shard, that account may be experiencing a complete outage. Application segmentation is what turns the harmless-looking average into an actionable signal.
The blast radius can be narrow: one identity-provider connection, one region, one subscription tier, one feature flag, or one customer-specific integration. Broad checks wash these failures out. And then support becomes your monitoring system.
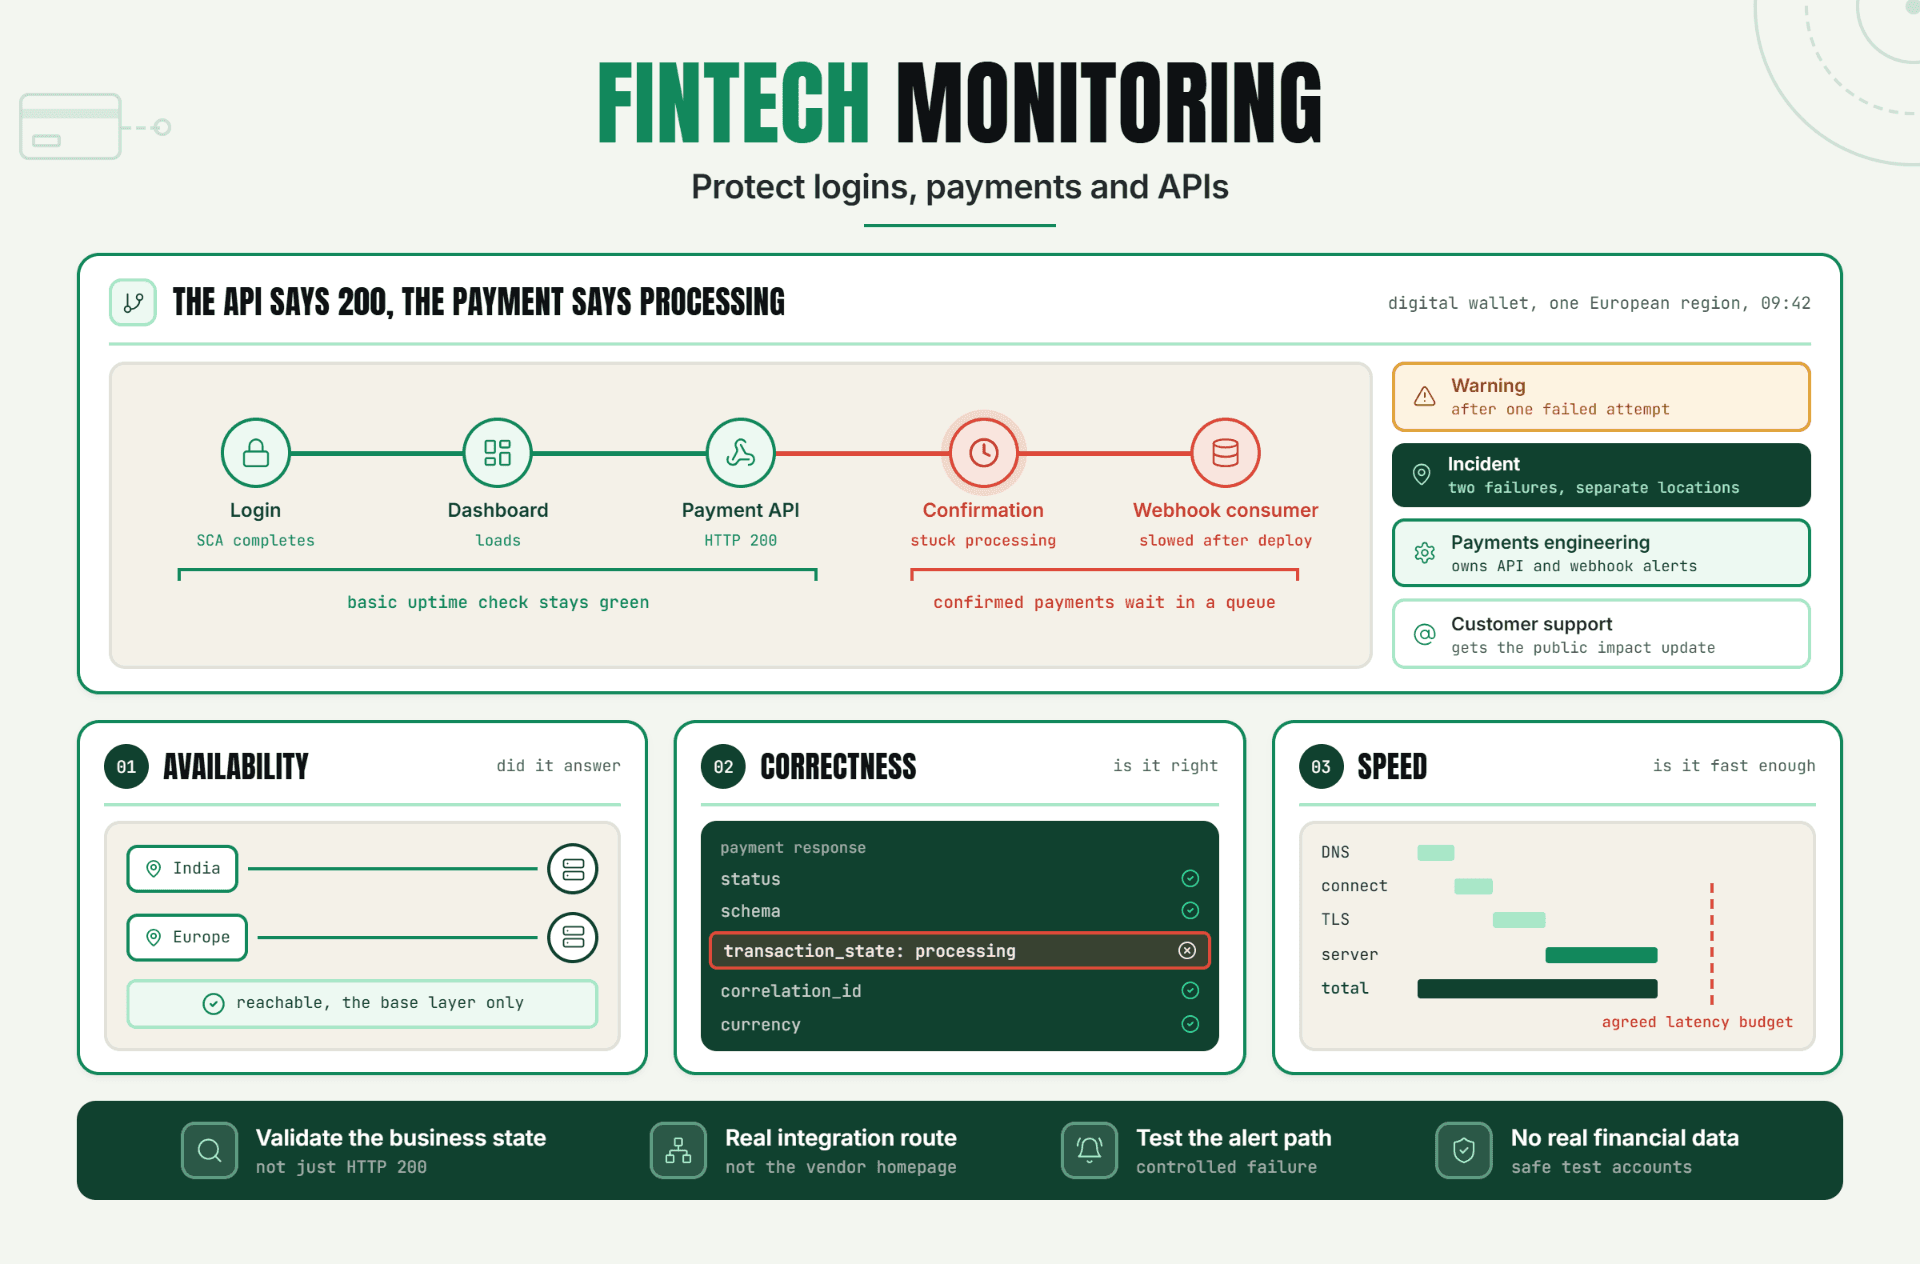
Statixoup’s guide to webhook monitoring and delivery validation shows the same principle at an integration boundary: a responding endpoint isn’t proof that the event was accepted, validated, and processed.
How Multi-Tenant SaaS Monitoring Actually Works
Multi-tenant SaaS monitoring combines black-box journeys with tenant-aware telemetry. The outside-in check proves a user-visible action works. The inside-out data explains which tenant, tier, shard, or dependency caused it to fail.
Google’s Site Reliability Engineering guidance defines four golden signals: latency, traffic, errors, and saturation. It also gives a sharp warning about averages: at 1,000 requests per second and 100 ms average latency, 1% of requests could still take five seconds. That tail can belong disproportionately to one tenant. The practical lesson is simple: segment the four signals before you trust the average. See Google SRE’s monitoring guidance.
Start With Customer Account Health, Not Server Health
Customer account health is the answer to a small set of binary questions:
- Can this tenant authenticate through its normal identity path?
- Can it load its own core data?
- Can it write or update a safe test record?
- Can it finish the main revenue or operational workflow?
- Does the result arrive within the tenant’s latency objective?
A CPU graph can help diagnose a failure. It can’t prove that SAML mapping, row-level security, feature entitlements, or tenant-specific encryption keys are correct. That’s why tenant-specific monitoring has to include the application path.
Build Synthetic Tenant Checks Around Real Journeys
Synthetic tenant checks are controlled transactions run through representative test accounts. They should behave like real users without modifying production customer data.
Use at least three synthetic identities when the architecture warrants it: a standard shared-infrastructure tenant, a premium or enterprise tenant, and a tenant mapped to a different region or shard. Add more only when a genuinely different execution path exists.
Keep the Synthetic Data Safe
Give each test tenant the lowest permissions required. Tag its records clearly, exclude it from billing and analytics, rotate credentials, and make write actions idempotent. A browser check that creates 2,000 fake invoices isn’t a monitor. It’s an incident generator.
Statixoup supports Playwright-based browser monitoring with JavaScript rendering and transaction validation. Pair that with its 30-day beta to test a login-to-dashboard journey before expanding into write operations.
Add Tenant Context to Every Useful Signal
AWS’s SaaS Lens recommends treating tenants and tenant tiers as first-class operational concepts. It specifically calls for tenant context, such as tenant identifier and tier, in operational data so teams can drill into individual health and resource consumption. That’s the foundation of useful tenant-specific monitoring. See the AWS SaaS Lens operational guidance.
At minimum, attach these dimensions where privacy and cardinality controls allow:
- tenant ID or a stable pseudonymous tenant key
- subscription tier
- region and availability zone
- application version
- shard, cluster, or database pool
- identity-provider type
- feature-flag cohort
- request outcome and latency bucket
OpenTelemetry organizes observability around three core telemetry signals: traces, metrics, and logs. Use them together. Metrics show that one cohort is unhealthy, traces show the failing path, and logs carry the bounded tenant context needed for diagnosis. The OpenTelemetry observability primer explains how those signals differ.
Set Thresholds Against Impact, Not Neat Percentages
One failed check shouldn’t always page someone. Three consecutive login failures for a premium test tenant probably should. Context matters.
Use separate rules for detection and escalation:
| Signal | Warning condition | Page condition | Likely owner |
|---|---|---|---|
| Synthetic login | 1 failure from 1 location | 2 failures from 2 locations | Identity team |
| Core data read | p95 exceeds tenant SLO for 5 minutes | Read fails or breaches SLO for 10 minutes | Platform team |
| Tenant error ratio | 2x normal baseline | More than 20% for a high-value tenant | Service owner |
| Shard saturation | Above 70% and rising | Above 85% with latency impact | Database team |
| Webhook delivery | Retry rate rises above baseline | Critical event fails after retry policy | Integrations team |
The exact numbers are examples, not universal defaults. Baseline them against your traffic, contracts, and error budgets. My stance is fairly blunt: a threshold you can’t connect to customer impact doesn’t belong on a pager.
A Five-Step Setup for Tenant-Specific Monitoring
- Map execution paths. List the regions, shards, identity routes, tiers, and feature-flag cohorts that produce materially different behavior.
- Create safe synthetic tenants. Give each account stable fixtures and minimal permissions.
- Test one critical journey. Start with login, a core data read, and a clear content assertion.
- Attach tenant context. Add bounded tenant, tier, region, version, and shard attributes to traces, metrics, and logs.
- Route by ownership. Send an actionable alert with the failed step, affected segment, evidence, runbook, and accountable team.
The result is multi-tenant SaaS monitoring that finds a narrow outage and points responders toward its boundary. Don’t begin with 40 workflows. Prove one path first.
For response messaging after detection, keep a pre-approved incident communication template ready so customer operations can communicate scope without guessing.
A Realistic SaaS Partial Outage: One Tenant, One Shard, Zero Global Alerts
This is an illustrative production scenario, not a Statixoup customer claim.
Imagine a document-management SaaS with 600 tenants. One enterprise account sits on database shard eu-03, uses SAML, and has a new permissions feature enabled. A deployment changes a row-level security policy for that feature cohort.
The homepage works. Generic API checks return 200. Across all traffic, errors remain below 1%. Yet every document-list request for that tenant returns an empty payload. Users can log in, but their workspace looks erased.
What didn’t work? The team checked only /health, aggregate HTTP errors, and average latency. None of those assertions asked whether the correct tenant data came back.
The better monitor setup looks like this:
- Browser journey: sign in through the enterprise SAML test path, open the document list, and assert that a known fixture appears.
- API check: request the fixture using the synthetic tenant token and validate the response body, tenant boundary, and maximum latency.
- Segmentation: break down errors and empty-result responses by tenant key, shard, feature cohort, and release version.
- Validation: confirm the failure from a second monitoring location before paging.
- Evidence: attach the failed assertion, screenshot, response code, trace ID, tenant segment, and deployment marker.
- Routing: page the permissions service owner and notify customer operations with the known scope.
Now the outage becomes visible within the check interval. The trace points to the permissions service. The segment identifies eu-03 plus the new flag. Customer operations can contact the affected account before a dozen “my files disappeared” tickets arrive.
That’s the point of synthetic tenant checks. They don’t replace global uptime. They expose the failure global uptime mathematically hides.
Best Practices for Multi-Tenant SaaS Monitoring
Cover Distinct Paths, Not Every Customer
Monitor representative architecture segments because one check per customer becomes expensive and noisy. Add a dedicated tenant check when the account has a unique identity provider, data plane, contractual SLO, or revenue-critical integration.
Match Frequency to Business Risk
Run login and core workflow checks every 30 to 60 seconds for critical paths. Slower checks may suit reporting exports or administrative workflows. Statixoup’s 30-second monitoring interval gives teams a practical starting point, but higher frequency only helps if alert validation and ownership are already clear.
Validate Meaning, Not Status Codes
Assert expected content, permissions, redirects, and timing because HTTP 200 can carry an error page, empty dataset, or another tenant’s data. That last case is a security incident, not merely downtime.
Keep Monitor Ownership Visible
Every check needs an owner, runbook, escalation path, and review date. Google SRE notes that a 10 to 12-person SRE team may assign one or two members primarily to monitoring. The number won’t fit every company, but the message does: monitoring needs maintenance capacity.
Connect Detection to Communication
Separate internal diagnosis from public communication. Use tenant impact to decide whether to contact one account, update a component, or publish a wider incident. Statixoup’s guide to status page notifications can help choose between email, SMS, webhook, and RSS updates.
Common Mistakes That Make Tenant Checks Misleading
Checking Only the Default Tenant
It happens because the seed account is convenient. But it usually follows the simplest route. Replace it with a small matrix covering real architectural differences.
Creating One Monitor per Customer
This feels thorough and quickly becomes unmanageable. Group customers by execution path, then reserve dedicated checks for genuinely unique or high-impact accounts.
Alerting on a Single Location
A transient network problem can create noise. Validate from a second location or repeat the check before paging, unless the workflow carries immediate security risk.
Forgetting Background Work
The browser journey passes while invoice generation, imports, or scheduled notifications silently stop. Pair customer-facing checks with heartbeat monitoring. Statixoup’s cron job monitoring guide explains how missed heartbeats catch jobs that fail without a visible error.
Logging Raw Customer Identifiers Everywhere
Tenant context is necessary. Unbounded or sensitive identifiers are not. Use stable pseudonymous keys, control access, define retention, and avoid putting customer secrets or personal data into telemetry.
The Main Takeaway
Your platform isn’t healthy because the average is green. It’s healthy when each important customer path works within its promised boundary.
Start with one representative tenant journey, segment the signals that explain it, and route the result to someone who can act. That small setup will teach you more than another wall of global charts.
Start Monitoring Tenant Journeys With Statixoup
Global uptime is the baseline. Now test the customer path it misses.
Start your 30-day Statixoup beta and configure a browser or API monitor for one representative tenant. Validate login, core data, expected content, and response time. Then add the segment and routing context your team needs to act before the first support ticket lands.
Post a Comment

Hardik Vaghani
Hardik Vaghani is a Digital Marketing Professional and SEO Strategist based in Surat, Gujarat, India. He currently works with Ethnic Infotech, contributing to SEO, content marketing, technical SEO, and digital growth strategies. Hardik also creates blog content for Fusion5, focusing on technology, laptops, and consumer electronics. With expertise in SEO, Google Ads, Meta Ads, Local SEO, and Content Strategy, he helps businesses improve online visibility, rankings, and lead generation through data-driven marketing.
Frequently Asked Questions
Related Blogs