SaaS Monitoring Checklist: Uptime, APIs, SSL & Status Pages
Most teams find out their SaaS product is broken through support tickets, not monitoring, since a green homepage says nothing about whether login or billing actually works. This blog covers building a real SaaS monitoring checklist: customer journeys, uptime, APIs, jobs, SSL, and alert routing that catches real incidents.
A SaaS monitoring checklist is a written map of critical services, the checks that test them, acceptable thresholds, alert owners, and customer-communication steps. At minimum, it should cover availability, response correctness, latency, API behavior, background jobs, SSL/TLS expiry, dependencies, alert routing, and a public status page. The goal isn’t more alerts. It’s earlier proof of real customer impact.
My view is blunt: a monitor that only asks whether the homepage returned HTTP 200 is barely a monitor. It proves a web server answered. It doesn’t prove login works, data loads, billing succeeds, or a nightly job finished.
Why a Green Homepage Can Hide a Broken SaaS Product
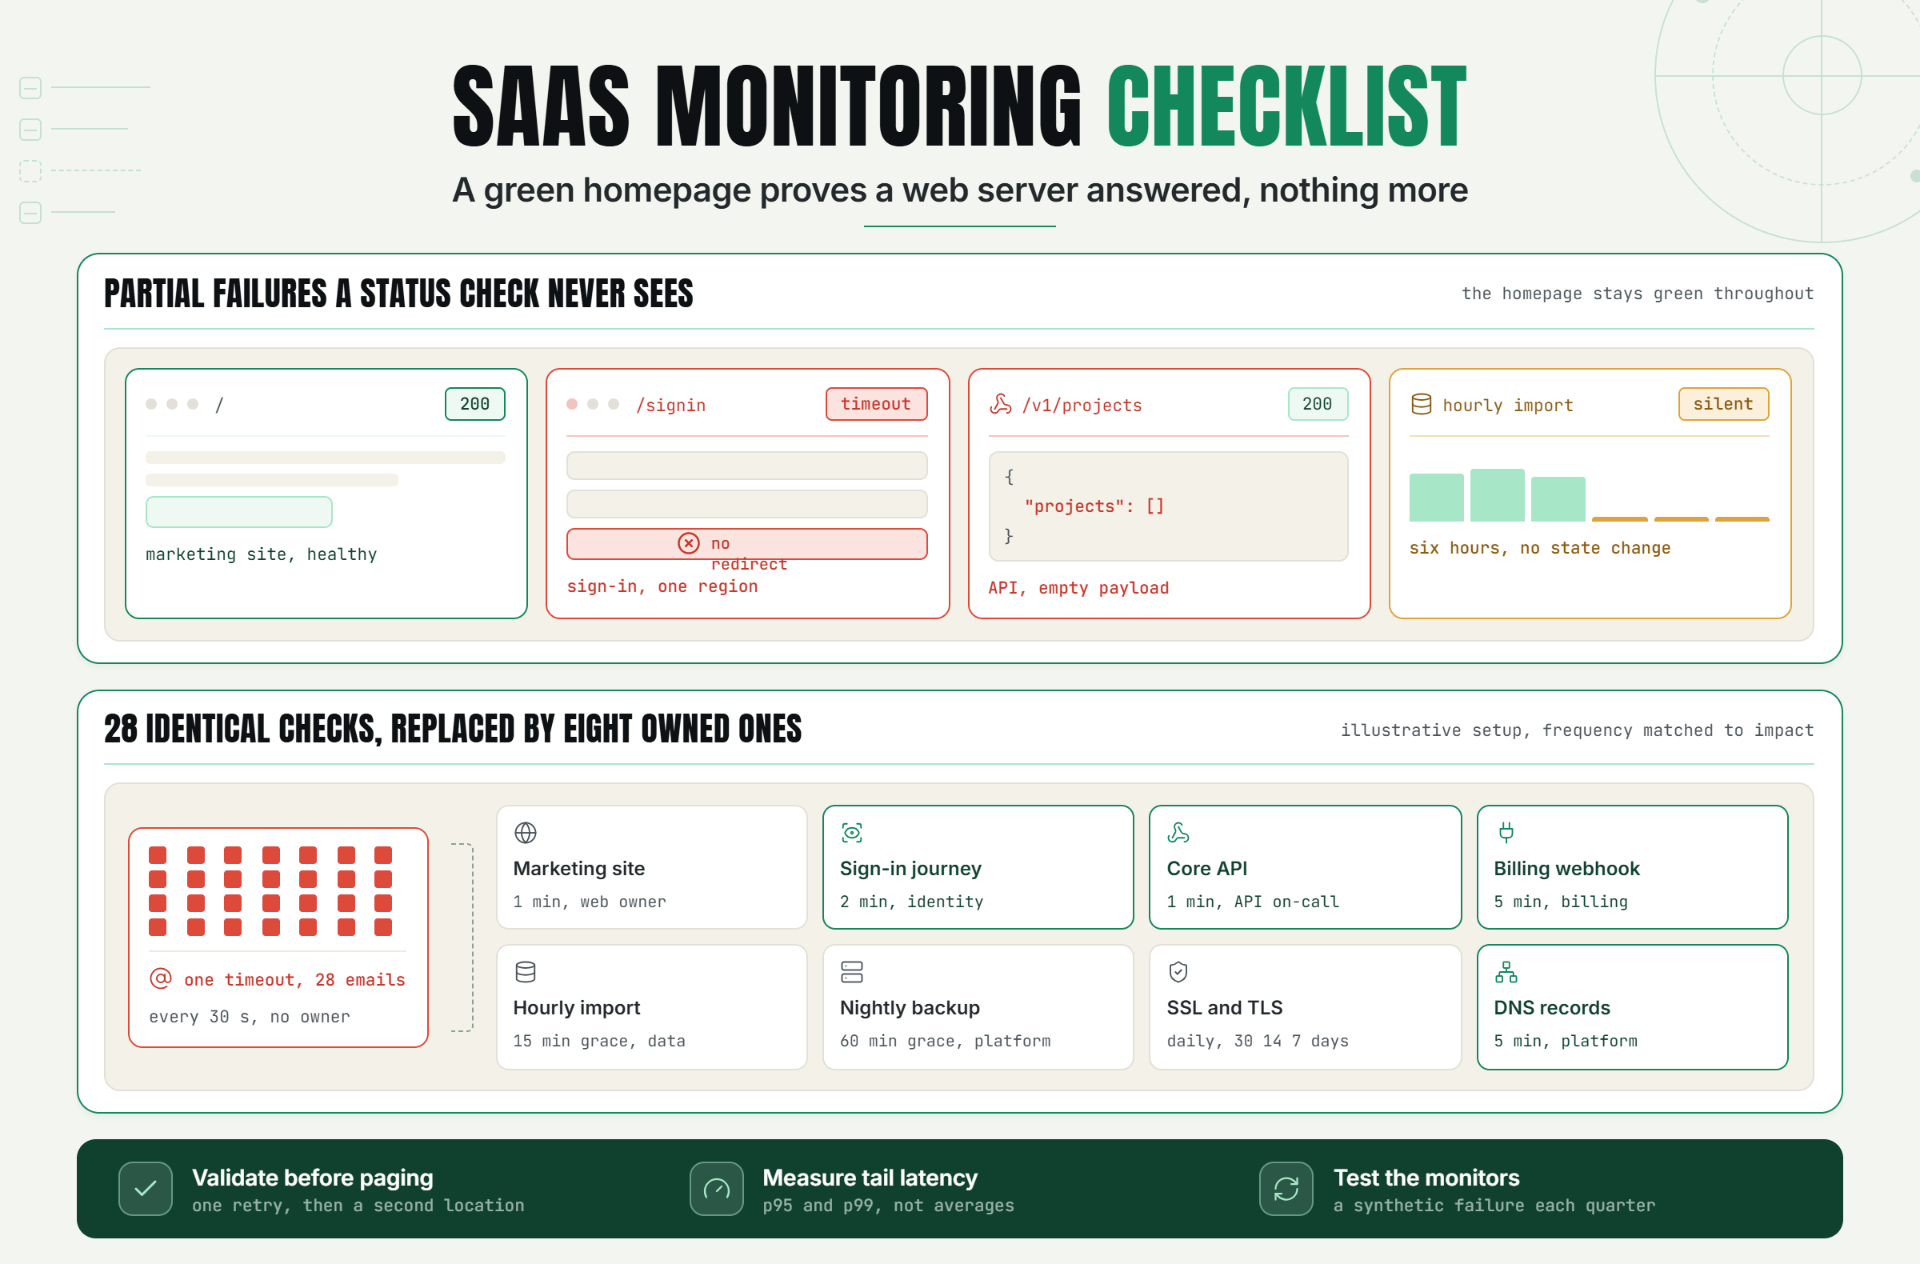
The operational risk isn’t simply “the website might go down.” SaaS products fail in partial, awkward ways. Authentication works in Europe but times out in Asia. The API returns 200 with an empty payload. A billing webhook stops processing. A certificate renews on the main domain but expires on an API subdomain. The dashboard loads while every background export sits in a queue.
Without a SaaS monitoring checklist, teams usually discover these failures through support tickets. That creates three delays: a customer notices the issue, explains it, and waits while engineering tries to reproduce it. The result is a longer mean time to detect and a messier mean time to repair. A SaaS monitoring checklist gives the team a detection path before that first ticket arrives. Statixoup’s guide to MTTD vs MTTR explains why detection and recovery need separate measurement.
There’s another cost. Weak alerts train people to ignore alerts. A noisy channel feels busy, but it often has less operational value than five carefully chosen checks. We covered the validation problem in the guide to reducing false positive alerts.
How the SaaS Monitoring Checklist Works
A useful SaaS monitoring checklist works from the customer journey inward. Black-box checks confirm what a customer can do. Internal metrics then help engineers explain why that journey failed. Google SRE calls these external and internal views black-box and white-box monitoring, and recommends watching four golden signals: latency, traffic, errors, and saturation. The Google SRE monitoring guidance also warns that paging a human is expensive, so alerts should represent urgent, actionable problems.
That distinction matters. If an API latency graph rises but customers can still complete their work, engineering needs evidence and perhaps a ticket. If sign-in fails across two regions, somebody needs a page now. The SaaS monitoring checklist should make that difference explicit.
1. Map Critical Customer Journeys
Start with five to ten actions that make the product valuable. Typical examples include creating an account, signing in, loading the main dashboard, saving a record, running a report, inviting a teammate, and upgrading a plan.
For each action, record the entry point, dependencies, expected result, failure impact, and service owner. This turns the SaaS monitoring checklist into an operational map instead of a shopping list of monitor types. Keep those fields consistent across every row of the SaaS monitoring checklist.
A simple journey test
For sign-in, don’t stop at the login page. Submit a controlled test account, confirm the authenticated redirect, and verify a known element on the dashboard. If the product uses multi-factor authentication or an external identity provider, monitor that dependency separately and avoid tests that can lock the account.
Transaction monitoring belongs here. It tests a sequence, while a standard uptime check tests one endpoint. The homepage can stay available through an entire authentication outage. Put each paid or retention-critical transaction near the top of the SaaS monitoring checklist. That’s why website online but not working is a real incident pattern, not a contradiction.
2. Set Up SaaS Uptime Monitoring
SaaS uptime monitoring should cover the public website, application domain, regional endpoints, and any customer-facing subdomains. Check the expected status code, response body, redirect chain, and response time. A 200 response with a maintenance message isn’t success.
Check frequency should match impact. Write the chosen interval and its reason into the SaaS monitoring checklist. Google SRE notes that probing once or twice per minute can be reasonable for a service targeting 99.9% annual uptime. At 99.9%, the mathematical error budget is about 8 hours 46 minutes per year. At 99.99%, it drops to about 52 minutes 36 seconds. Those targets change how quickly you need to detect and escalate failures.
The practical sequence is: 1. Check the endpoint. 2. Validate the status and expected content. 3. Retry once after a short delay. 4. Confirm from another location when possible. 5. Open or update one incident. The result is faster detection without paging on every transient network error.
For more detail, use Statixoup’s guides to uptime monitoring and choosing a monitoring interval.
3. Monitor APIs for Correctness, Not Just Availability
API monitoring asks a harder question: did the endpoint return the correct response within the allowed time? A strong check verifies the HTTP method, authentication, status, headers, JSON fields, schema or content rules, and latency. Your SaaS monitoring checklist should name the exact assertion, not simply say “monitor API.”
Consider GET /v1/projects. A shallow monitor accepts any 200 response. A useful monitor also checks that the response is valid JSON, contains the projects key, and completes within the threshold. For a write endpoint, use isolated test data and clean it up safely.
Don’t use one universal latency threshold. A health endpoint may need to finish in 500 milliseconds, while a report-generation endpoint may legitimately take 15 seconds. Record both thresholds in the SaaS monitoring checklist. Track successful and failed request latency separately. Google SRE points out that a fast HTTP 500 is still a failure and can make an average latency chart look deceptively healthy.
4. Use Cron Monitoring for Background Jobs
Scheduled jobs fail quietly. A database backup, invoice run, data import, queue worker, or daily customer report can stop while every public endpoint remains green. Cron monitoring closes that gap with a heartbeat.
The job sends a ping when it starts, succeeds, or fails. The monitor expects that signal inside a defined window. If a job due at 02:00 normally finishes by 02:20, an alert at 02:01 is noise. Set a grace period based on real runtime variation and alert after the completion window expires. The SaaS monitoring checklist should show the schedule, deadline, and grace period together.
Add context to the heartbeat: job name, environment, run ID, start time, duration, result, and processed-record count. Don’t include secrets or customer data. For a destructive or money-moving job, pair the heartbeat with an outcome check, such as confirming that an expected ledger entry or output file exists.
5. Monitor SSL/TLS Certificates and DNS
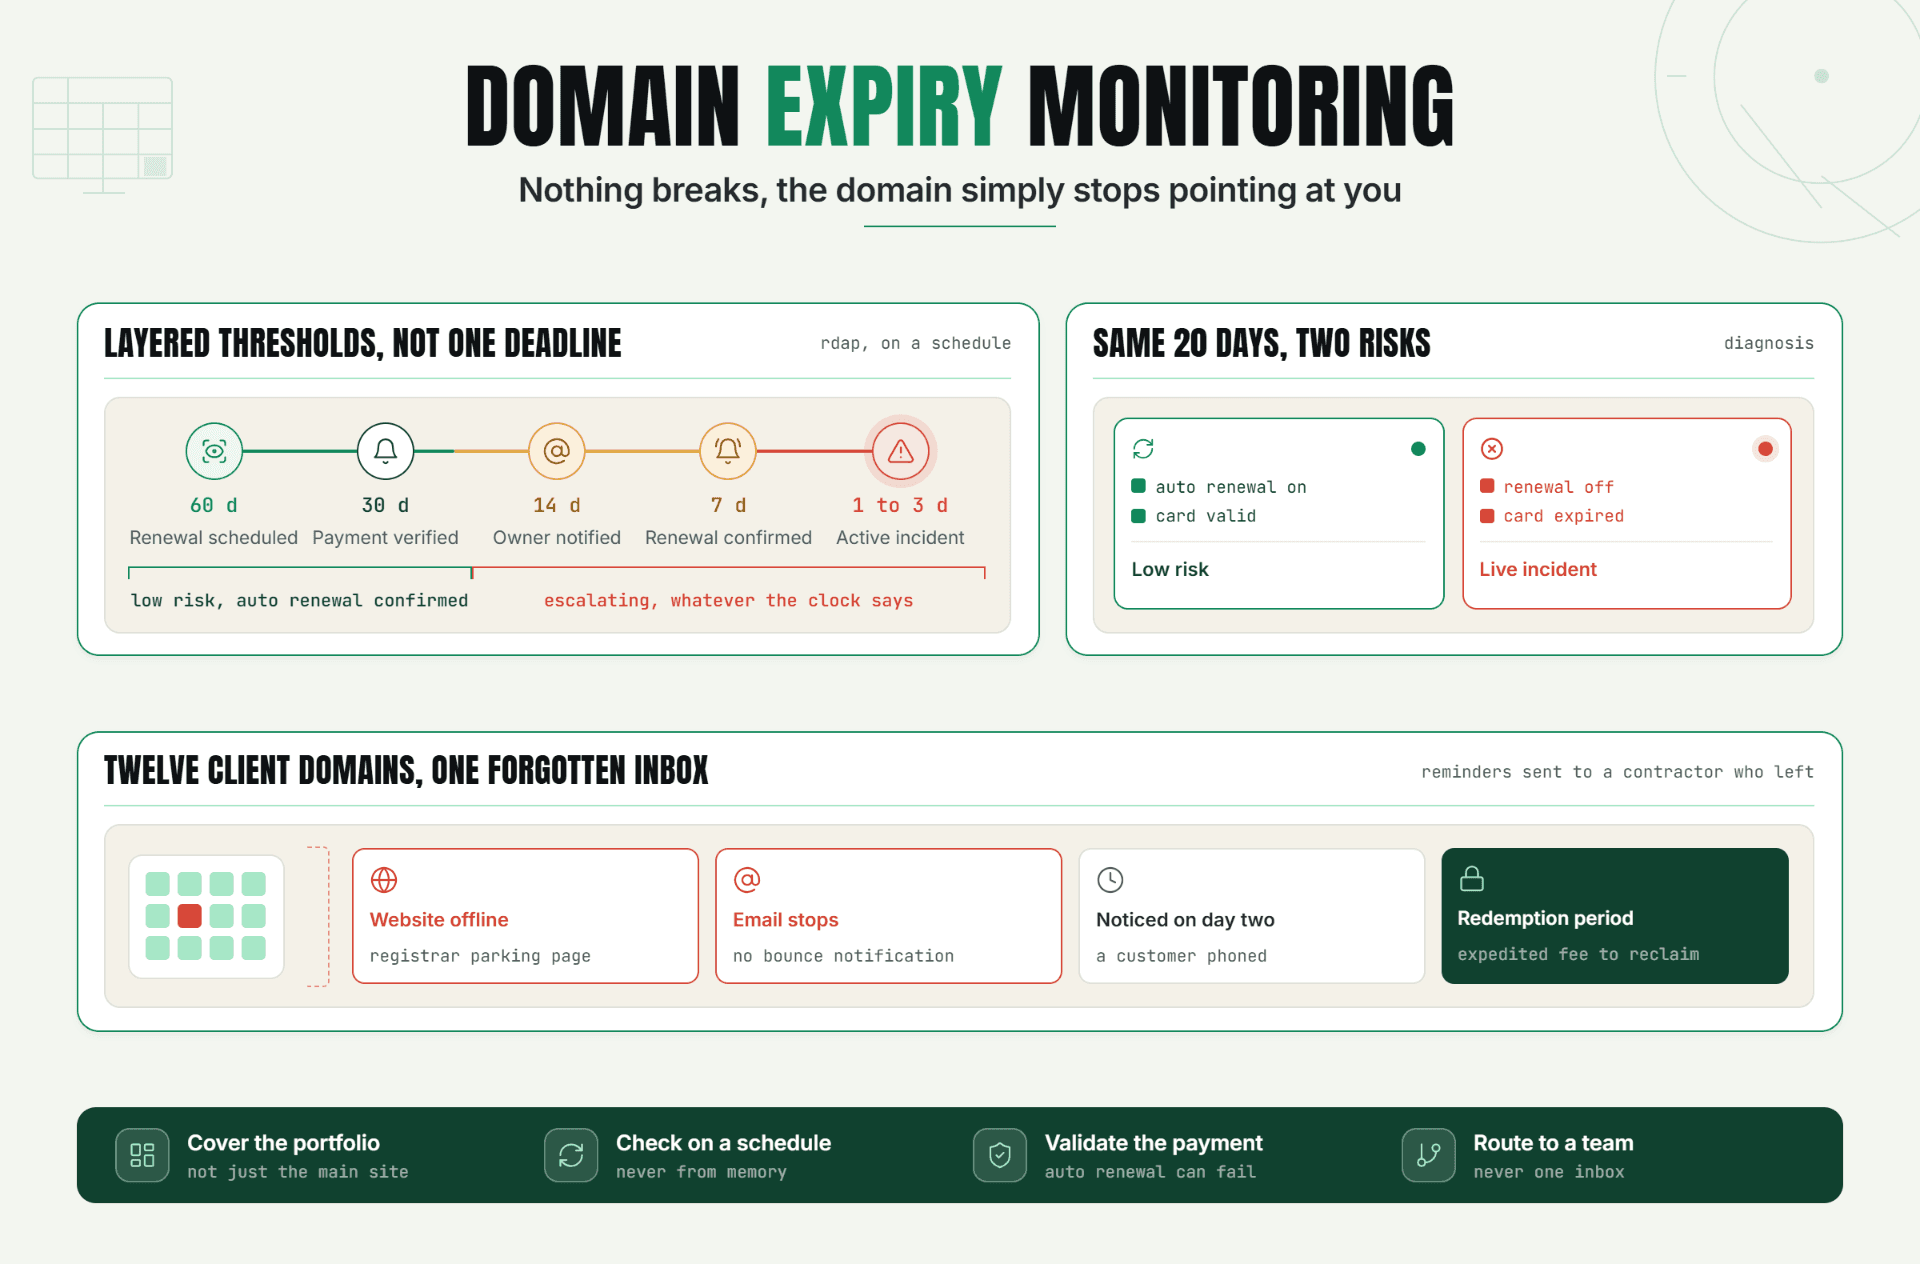
Certificate expiry is predictable. That’s exactly why it’s embarrassing when it causes an outage. Monitor the certificate chain, hostname match, expiry date, and renewal window for every production hostname, including API, webhook, admin, and regional subdomains. List those hostnames individually in the SaaS monitoring checklist.
Let’s Encrypt says its default certificates still have 90-day lifetimes, while industry rules will cap certificate lifetimes at 47 days from March 15, 2029. Its own maximum is planned to fall to 45 days by February 2028. The Let’s Encrypt certificate lifetime roadmap is a strong reason to automate renewal and keep expiry monitoring independent of the renewal process.
Set warnings at more than one point, such as 30, 14, and 7 days, then route the final warning more urgently. Put the warning stages and owner in the SaaS monitoring checklist. Test the real hostname from outside your network. A certificate can exist in storage and still be missing from the load balancer serving customers.
DNS deserves separate coverage because a healthy origin is useless when records point somewhere else. Track expected A, AAAA, CNAME, MX, and nameserver records where relevant. Statixoup’s DNS monitoring guide covers how record changes can create outages before an application monitor explains the cause.
6. Connect Alerts to Ownership and Escalation
Every row in the SaaS monitoring checklist needs an owner. “Engineering” is not an owner. Use a primary role, backup role, acknowledgement window, escalation route, and recovery notification.
Severity should follow impact. A failed marketing-page image can wait. A failed login or payment path cannot. Warnings belong in a ticket or team channel. Critical, verified customer impact belongs in an interruptive channel with an acknowledgement timer. Write that severity and timer into the SaaS monitoring checklist before enabling the alert.
Most guides won’t tell you this, but adding channels often makes routing worse. Email, Slack, SMS, voice, and webhooks solve different jobs. They don’t fix missing ownership. Design the escalation policy first, then pick the few channels it needs. The incident alert routing guide gives a practical structure.
7. Publish a SaaS Status Page
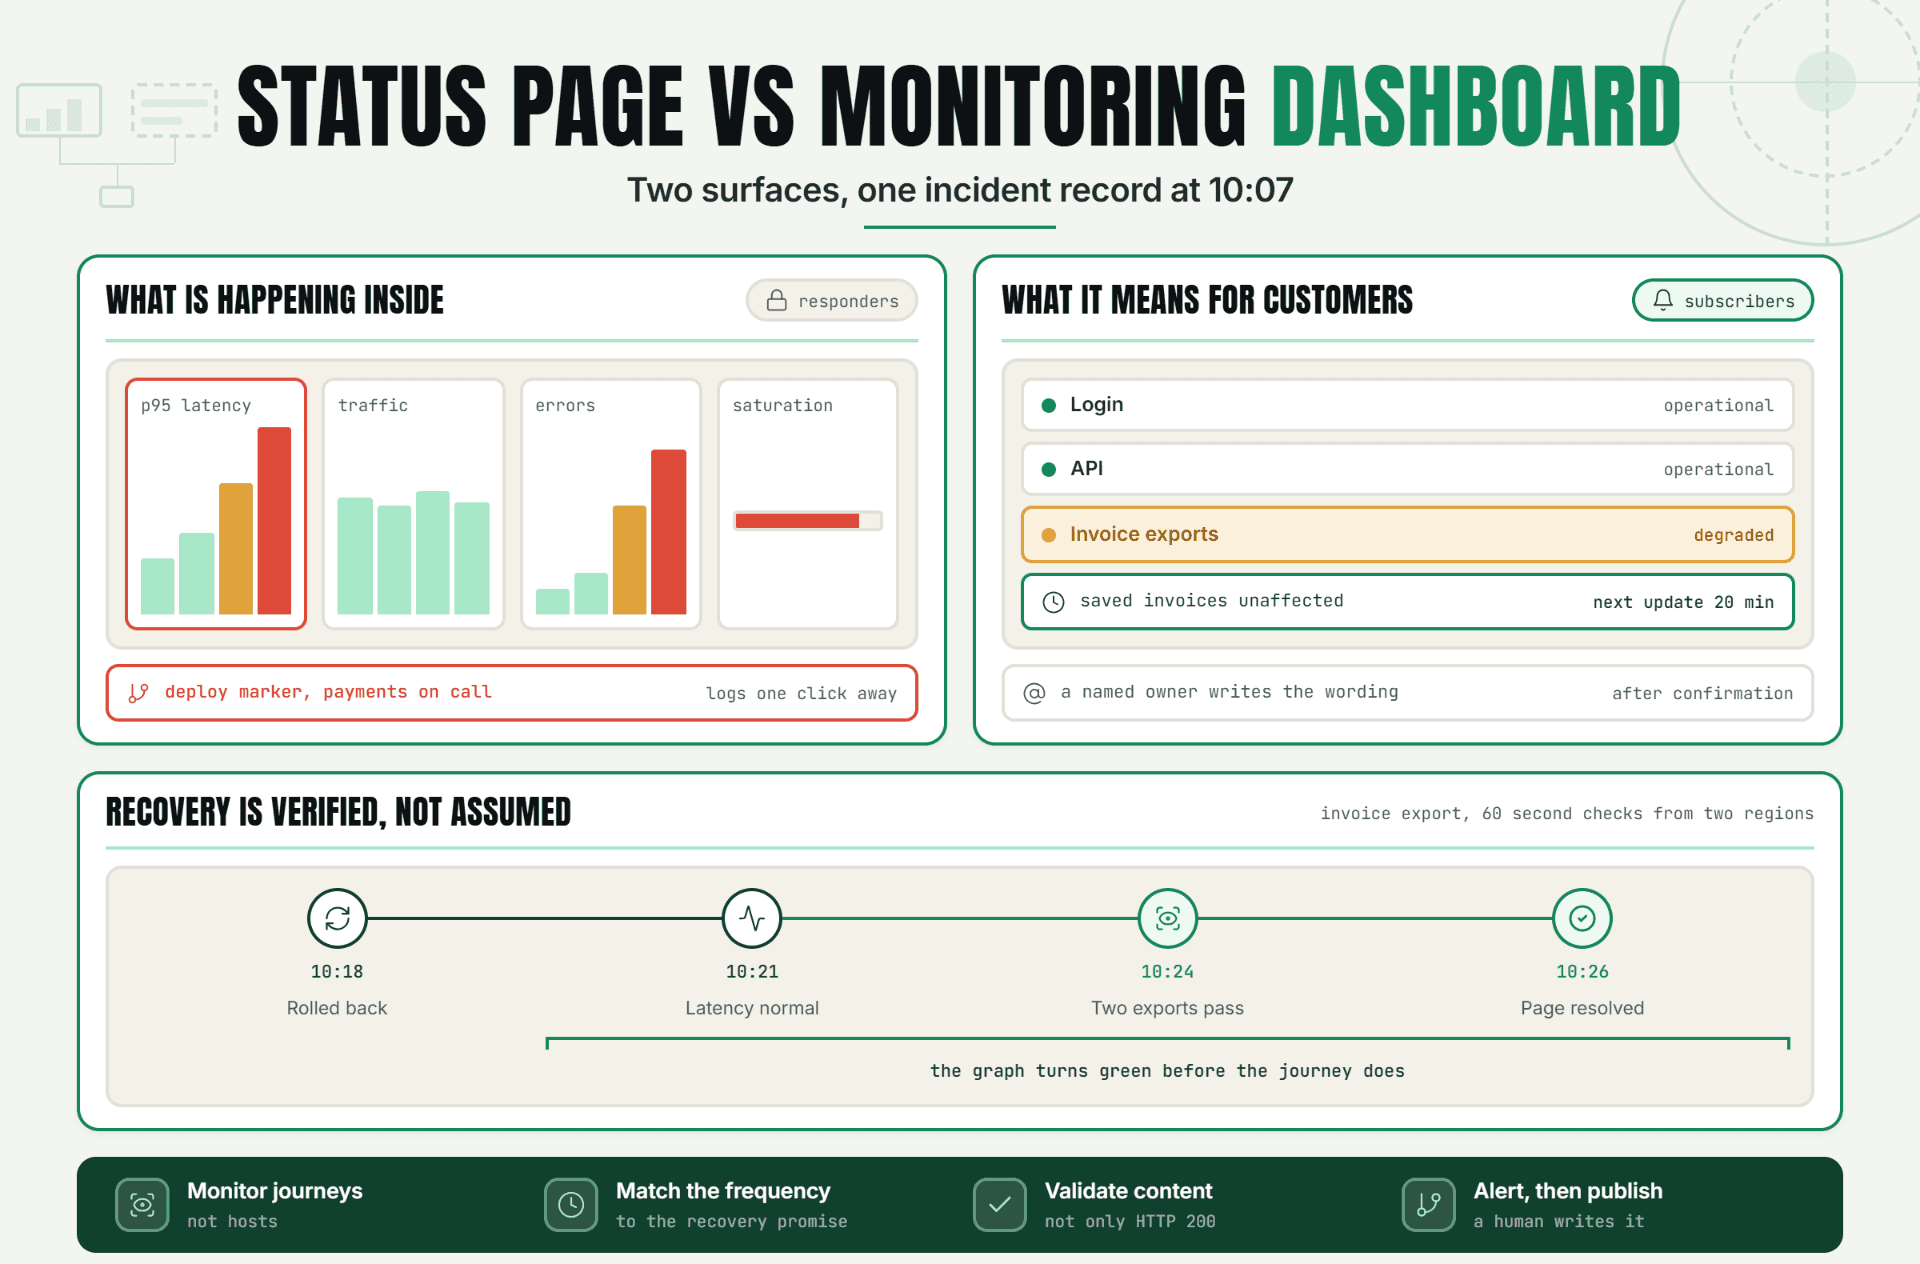
A SaaS status page is the customer-facing half of incident response. It should show the affected components, current state, time of the last update, incident history, and subscription options. Keep internal debugging details in the private monitoring dashboard. The SaaS monitoring checklist should also name who can publish an update.
Monitoring and status pages are related, but they aren’t interchangeable. Monitoring detects and diagnoses. A status page communicates. During an incident, link internal monitors to a single incident record and update the public status only with confirmed, customer-relevant facts.
Use plain language. “Elevated 5xx rate in auth-service-prod-us-east-1” may be accurate, but customers need “Some users can’t sign in.” State what’s affected, what still works, what the team is doing, and when the next update will arrive. Keep a short message template beside the status-page step in the SaaS monitoring checklist.
A Realistic Production Monitor Setup
Imagine a B2B SaaS product with a marketing site, app, REST API, Stripe billing, Google sign-in, hourly data imports, nightly backups, and customers in North America, Europe, and India. This is an illustrative scenario, not a claimed Statixoup customer result.
The team’s first setup looks thorough: 28 endpoint checks, identical 30-second intervals, email alerts to all six engineers, and no transaction test. It fails in practice. One regional timeout sends 28 emails. Nobody knows who owns billing. The nightly import stops for six hours, but no endpoint changes state. The problem is a monitor inventory without a SaaS monitoring checklist.
The revised SaaS monitoring checklist is smaller and clearer:
| Monitor | What it validates | Suggested frequency | Alert owner | Public status? |
|---|---|---|---|---|
| Marketing site | Status, homepage text, TLS | 1 minute | Web owner | Only for broad impact |
| Sign-in journey | Form submission, redirect, dashboard element | 2 minutes | Identity on-call | Yes |
| Core API | Auth, status, JSON field, latency | 1 minute | API on-call | Yes |
| Billing webhook | Signed request and processing result | 5 minutes plus event checks | Billing owner | Yes if purchases fail |
| Hourly import | Completion heartbeat and record count | Hourly with 15-minute grace | Data owner | If customer data is stale |
| Nightly backup | Completion heartbeat and restore verification record | Daily with 60-minute grace | Platform owner | Usually no |
| SSL/TLS | Chain, hostname, and expiry | Daily plus threshold alerts | Platform owner | If service is affected |
| DNS | Expected records and nameservers | 5 minutes | Platform owner | Yes if resolution fails |
Now one failed sign-in opens one incident, pages the identity owner, and posts evidence to the shared channel. If the incident persists, the team updates the SaaS status page. The SaaS monitoring checklist connects those actions before pressure hits. That’s the result you want: fewer alerts, clearer accountability, and evidence attached before responders start guessing.
Best Practices for Application Reliability
Build coverage from revenue and retention risk
Rank journeys by customer and business impact. Login, billing, core data access, and saved work usually beat low-traffic marketing pages. This keeps the SaaS monitoring checklist focused when time and budget are limited. Re-rank the SaaS monitoring checklist when the product or pricing model changes.
Validate before paging
Use one quick retry, a content assertion, or a second location because transient failures happen. But don’t stretch confirmation so long that the incident becomes old news. Test the rule against previous incidents and false alarms.
Give every monitor one accountable owner
Services belong to teams, but incidents need a first responder. Store the primary role, backup role, and escalation timer beside the check. Review routing after staff or on-call changes.
Measure tail latency
Averages hide pain. Track percentiles such as p95 or p99 for important APIs and journeys because a small group of slow requests can dominate the customer experience. Pair the performance view with Statixoup’s guide to website performance monitoring.
Test the monitoring system itself
Trigger a controlled synthetic failure at least quarterly. Confirm detection, notification, acknowledgement, escalation, status-page access, and recovery. Record the test date in the SaaS monitoring checklist. A SaaS monitoring checklist that has never been tested is still a theory.
Common SaaS Monitoring Mistakes
Mistake 1: Treating HTTP 200 as proof of health
Why it happens: status checks are quick to configure. What to do instead: validate content and test the actions customers pay for. Make those assertions visible in the SaaS monitoring checklist.
Mistake 2: Monitoring every component at the same frequency
Why it happens: one default feels simpler. What to do instead: match frequency to impact, normal runtime, and error budget. Daily certificate checks and one-minute login checks can coexist in the same SaaS monitoring checklist.
Mistake 3: Paging on causes instead of customer symptoms
Why it happens: infrastructure metrics are easy to collect. What to do instead: page on confirmed user impact, then attach CPU, database, queue, and dependency evidence for diagnosis. The SaaS monitoring checklist should distinguish paging signals from diagnostic signals.
Mistake 4: Forgetting third-party dependencies
Why it happens: the vendor has its own status page. What to do instead: test your actual integration with payment, email, identity, storage, and webhook providers. Add each critical dependency to the SaaS monitoring checklist. Their service can be green while your credentials or configuration are broken.
Mistake 5: Sending every alert to everyone
Why it happens: teams fear missing an incident. What to do instead: assign service ownership and use timed escalation in the SaaS monitoring checklist. Broadcasting responsibility usually removes responsibility.
Mistake 6: Leaving the public status page manual and ownerless
Why it happens: communication feels secondary during an outage. What to do instead: name the incident communicator, define update intervals, and keep a prepared template for investigation, identification, monitoring, and resolution updates. Link that template from the SaaS monitoring checklist.
Conclusion
The strongest SaaS monitoring checklist isn’t the longest one. It’s the one that catches failure in the customer journey, confirms the signal, reaches the right owner, and gives customers a clear update when impact is real. Keep the SaaS monitoring checklist close to the incident workflow, not buried in an old planning document.
Start with one paid or retention-critical journey. Trace every dependency behind it, add the right checks, and test the alert path. Then expand. That order creates application reliability faster than collecting dozens of disconnected metrics.
Start Monitoring with Statixoup
Start a free 30-day Statixoup trial and configure the monitor tied to your highest-impact customer journey. Add its success condition, check frequency, owner, and escalation path from this SaaS monitoring checklist. Begin with one service. Make that alert trustworthy before adding the next.
Post a Comment

Hardik Vaghani
Hardik Vaghani is a Digital Marketing Professional and SEO Strategist based in Surat, Gujarat, India. He currently works with Ethnic Infotech, contributing to SEO, content marketing, technical SEO, and digital growth strategies. Hardik also creates blog content for Fusion5, focusing on technology, laptops, and consumer electronics. With expertise in SEO, Google Ads, Meta Ads, Local SEO, and Content Strategy, he helps businesses improve online visibility, rankings, and lead generation through data-driven marketing.
Frequently Asked Questions
Related Blogs